Idea to market, FAST.
Idea to market, FAST.


Delivering Strategic Growth Through Data, Finance & Tech.
I will always meet your expectations on the fields stated
I will always meet your expectations on the fields stated


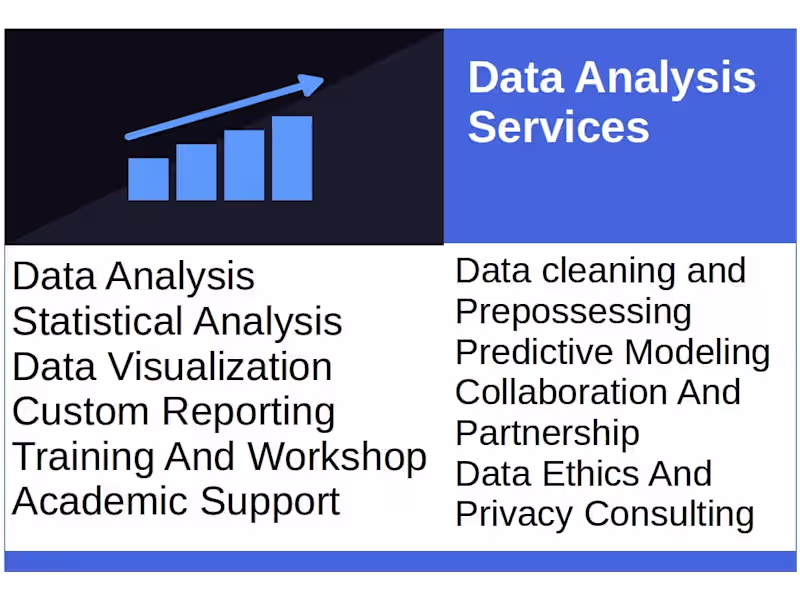
Statistician and Data Analyst Expert
Statistician and Data Analyst Expert


View more →
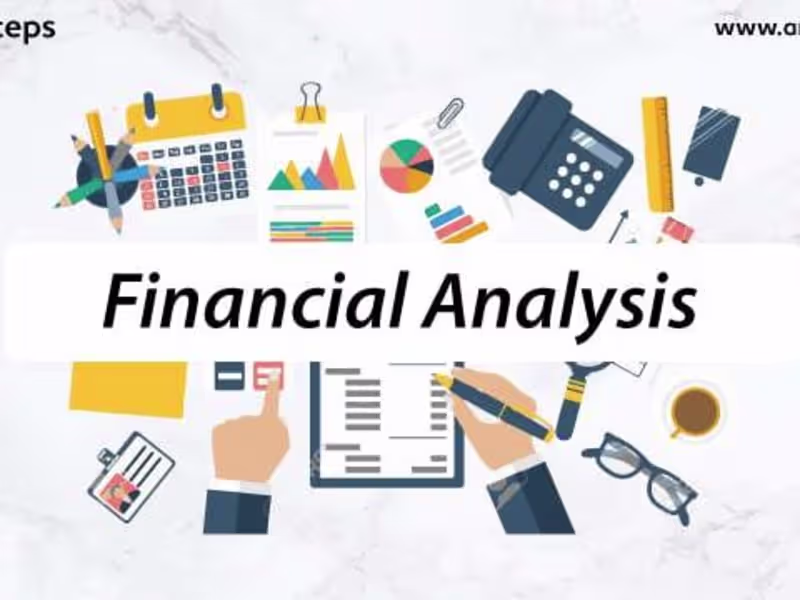
Financial Analyst,writer,Transcriptionist
Financial Analyst,writer,Transcriptionist


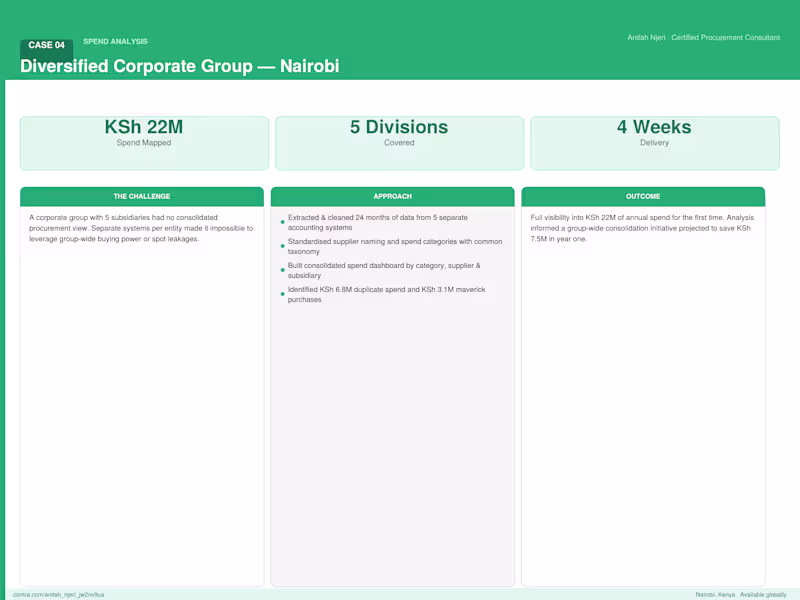
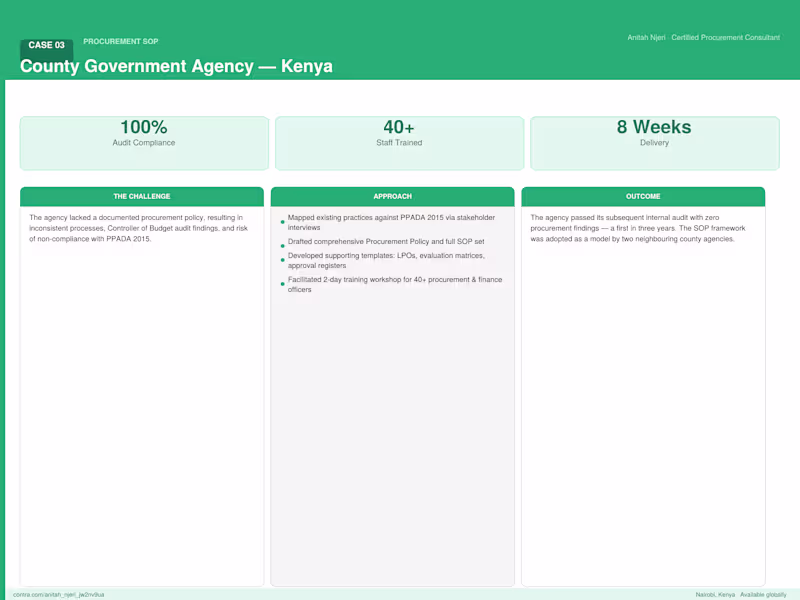
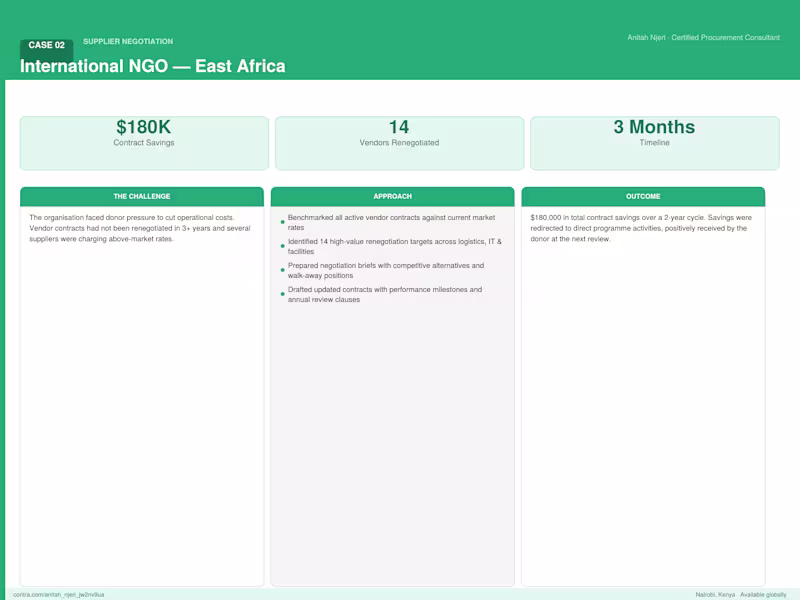
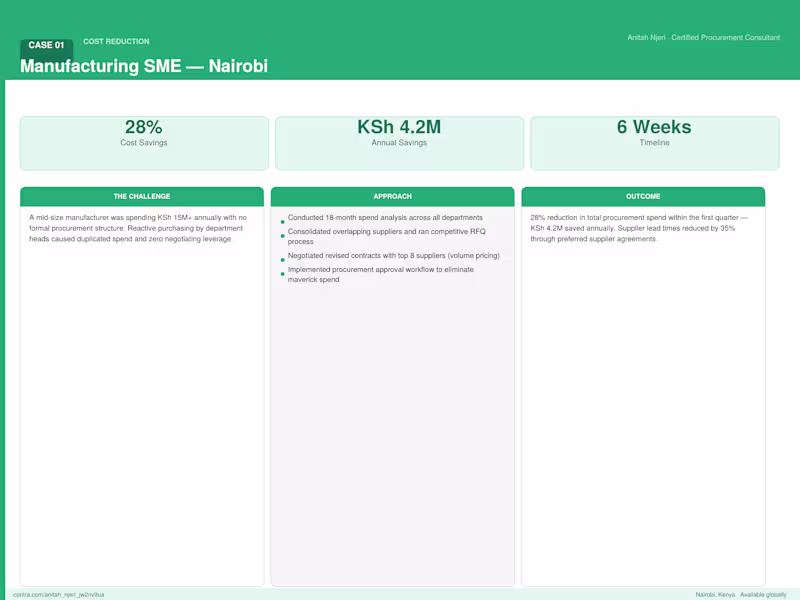
Certified Procurement Consultant | Cost Reduction Expert
Creative & Business Strategist


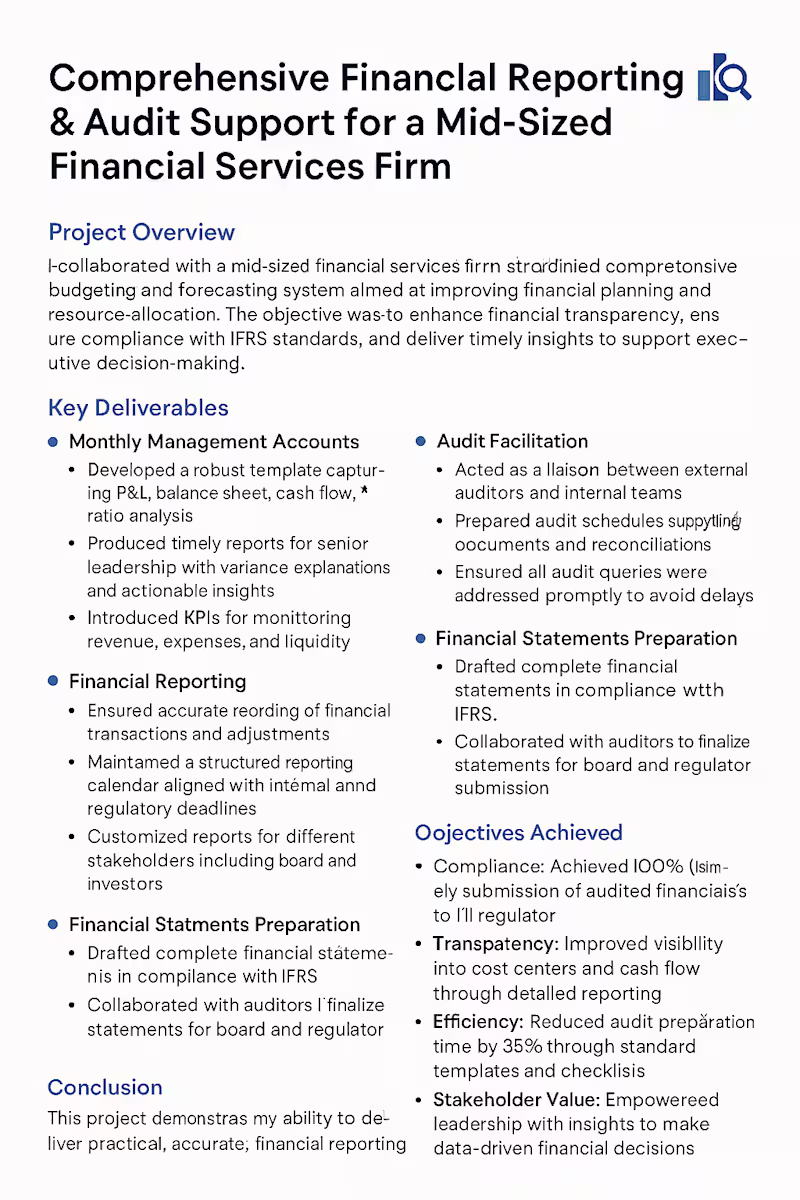
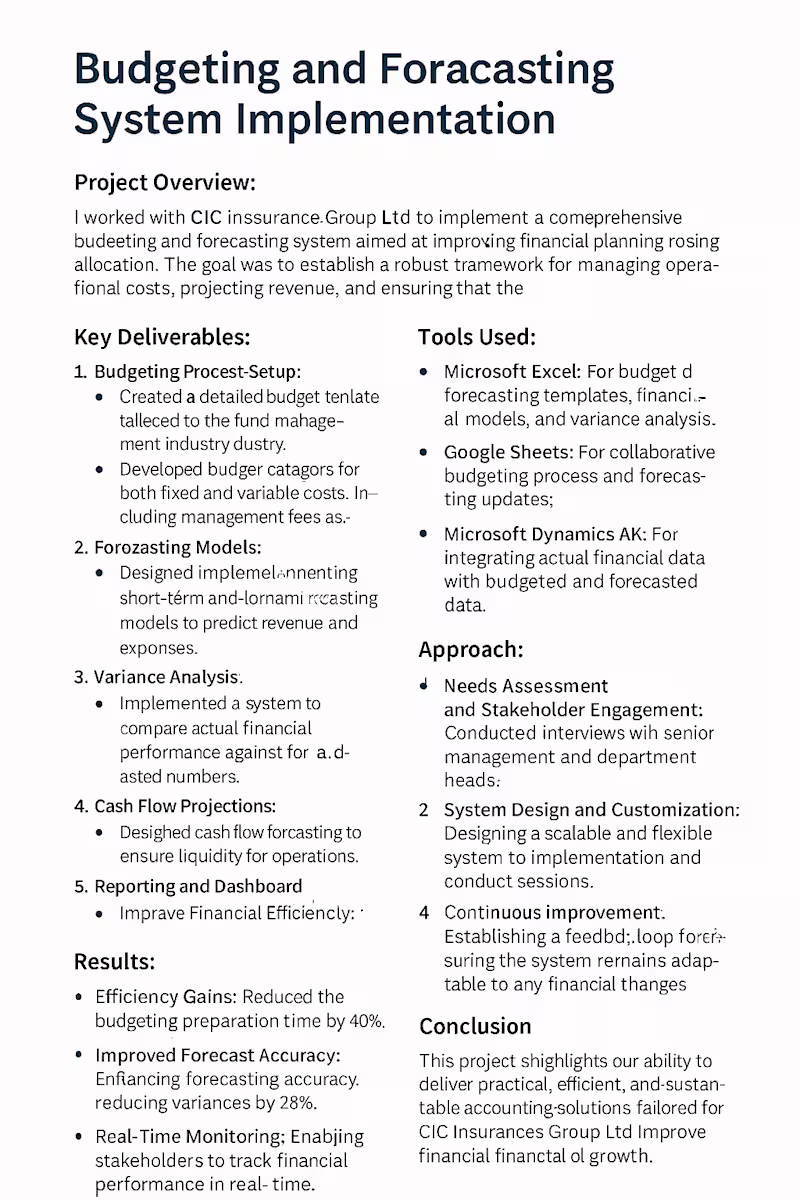
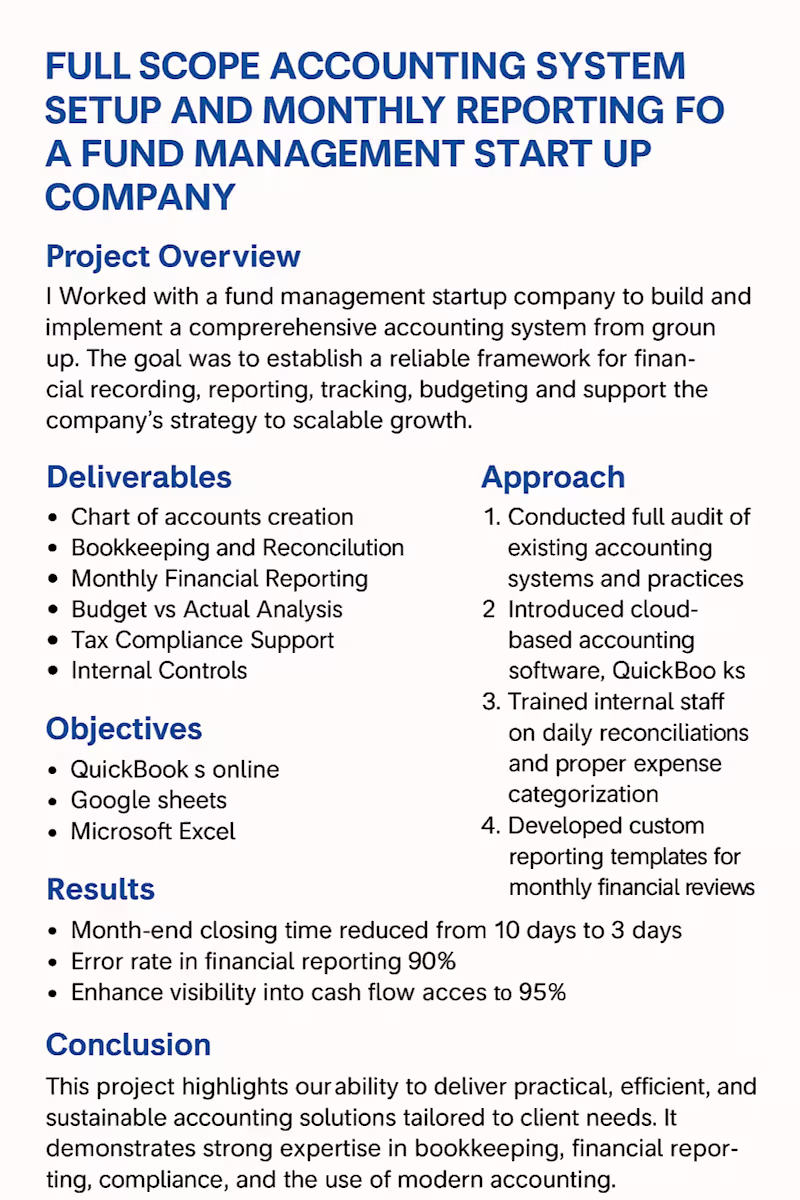
Avid accountant for financial reporting management accounts
Avid accountant for financial reporting management accounts