The network for creativity
Join 1.25M professional creatives like you
Connect with clients, get discovered, and run your business 100% commission-free
Creatives on Contra have earned over $150M and we are just getting started
Back to feedPost
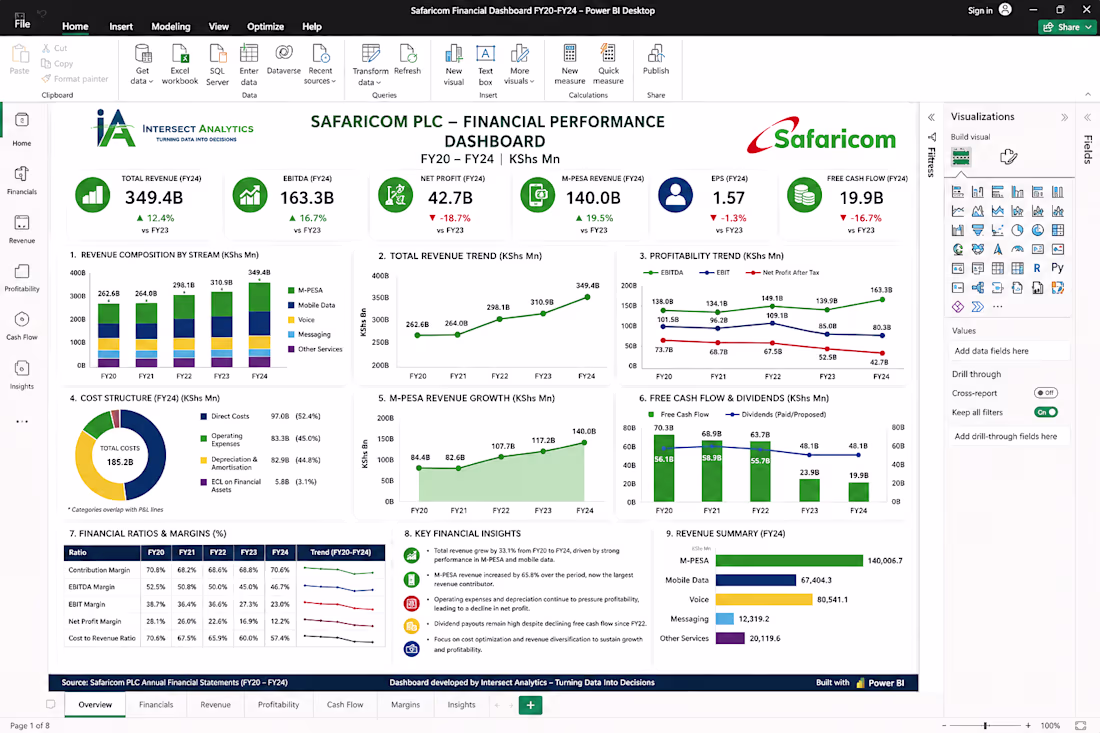
Safaricom Financial Performance Dashboard (FY20–FY24): Key Insights & Business Impact
The Safaricom Financial Dashboard provides a clear, data-driven view of performance over five years, highlighting both growth opportunities and critical financial pressures.
🔍 Key Findings
Strong Revenue Growth: Total revenue shows consistent growth, driven by digital transformation.
M-PESA Dominance: M-PESA has emerged as the largest revenue contributor, reinforcing its role as a core growth engine.
Mobile Data Expansion: Sustained growth in mobile data reflects increasing demand for digital services.
Decline in Traditional Revenue: Voice and messaging revenues continue to decline, signaling a shift in customer behavior.
Margin Pressure: Rising operating costs, direct costs, and ECL provisions are compressing profitability.
Profitability Decline: Net profit has decreased despite revenue growth—highlighting inefficiencies.
Cash Flow Concerns: Declining free cash flow indicates increasing capital demands.
High Dividend Payouts: Continued strong dividends despite cash flow pressure raise sustainability questions.
🚀 What This Means for Businesses
Growth alone is not enough — cost optimization and efficiency are critical
Businesses must track performance beyond revenue to understand true profitability
Real-time insights are essential to respond quickly to financial risks and opportunities
💼 How Intersect Analytics Adds Value
At Intersect Analytics, we go beyond dashboards — we deliver decision intelligence.
📊 Financial Analytics Expertise
Deep understanding of financial metrics, KPIs, and business drivers
⚙️ Custom Power BI Dashboards
Interactive, scalable dashboards tailored to your business needs
🔗 Data Integration & Automation
Seamless connection of multiple data sources with automated reporting
📈 Insight-Driven Decision Making
We don’t just show data — we explain the “why” behind it
🧠 Strategic Approach
Combining finance, analytics, and business strategy for real impact
✅ Why Choose Intersect Analytics
Proven experience in financial analytics & dashboard development
Solutions designed for clarity, scalability, and performance tracking
Strong focus on business impact — not just visuals
Reliable partner for end-to-end analytics and continuous support
📩 Looking to transform your financial data into actionable insights?
Let Intersect Analytics build a powerful, intelligent dashboard that drives smarter decisions and business growth.
Excellent insights John!
The network for creativity
Join 1.25M professional creatives like you
Connect with clients, get discovered, and run your business 100% commission-free
Creatives on Contra have earned over $150M and we are just getting started
Related posts
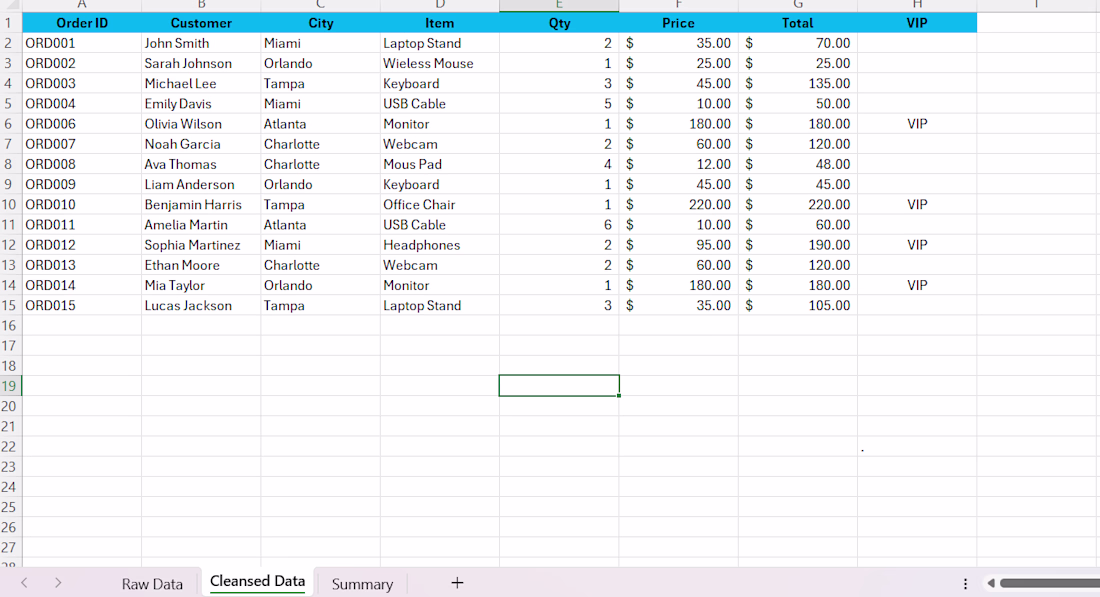
Show us the raw data! 😄
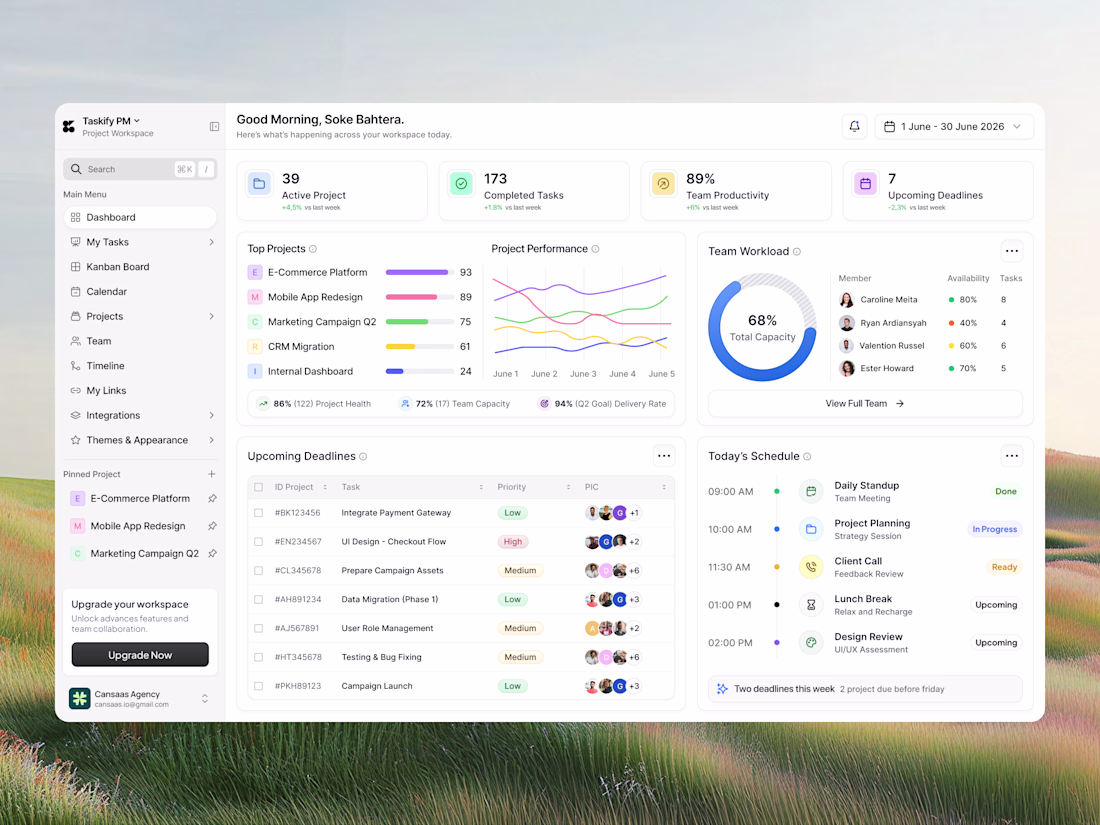
Managing multiple projects shouldn't feel overwhelming. This dashboard combines project tracking, team workload, productivity metrics, deadlines, and daily schedules into a clean, intuitive workspace designed for faster decision-making. Every component is built to improve clarity, reduce cognitive load, and help teams stay focused on what matters most.
📩 Collaborate with Us? Contra Cansaas Agency
Nice work👏
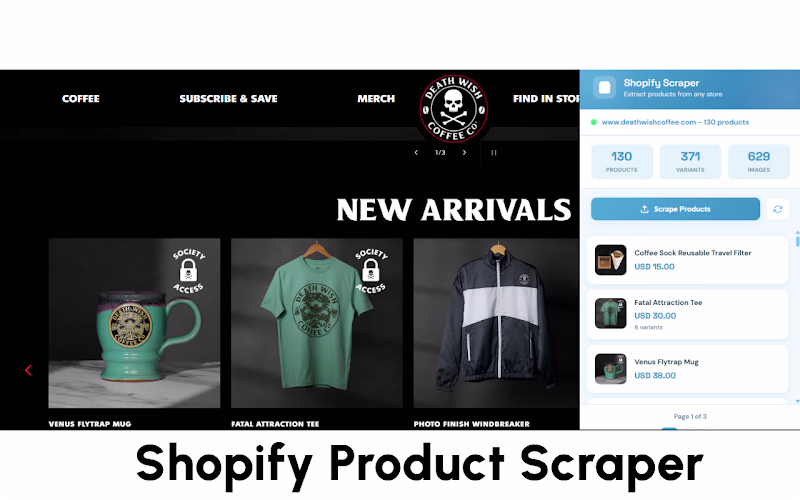
Shopify Products Scraper - Extension
Scrape all products from any Shopify store using products.json
Scrape Shopify products instantly. Export to CSV & JSON with variants, images, and full product data.
Shopify Product Scraper – Extract Store Data in Seconds 🚀
Shopify Product Scraper is a powerful Chrome extension that allows you to extract product data from any Shopify store quickly and efficiently.
Perfect for drop-shippers, developers, and researchers who need structured product data without manual effort.
🔥 Features
✅ Scrape all products from any Shopify store
✅ Supports both simple and variant products
✅ Export data in CSV and JSON formats
✅ Includes product images and links
✅ Clean, Shopify-compatible data structure
✅ Fast, lightweight, and easy to use
💡 Use Cases
Dropshipping product research
Competitor analysis
Bulk data extraction
Shopify store migration
Data analysis and automation
⚙️ How It Works
Install the extension
Open any Shopify store
Click the extension icon
Export product data instantly
https://chromewebstore.google.com/detail/diohjckocnkbflfjbelbagnkcaoljlnk?utm_source=item-share-cb
Clean feature set. Curious how you're handling Shopify's rate limiting on larger stores (1000+ SKUs) — pacing requests against products.json, or pulling in one burst?
Trending
Claude
Claude has entered the design space. How are you using Claude Design?
Contra University
Learn from expert creatives how to earn more using next-gen AI tools.
fifaworldcup2026
The World Cup is here and the whole world's watching. How are you designing for the world stage?
creativeaiflow
Creative AI workflows are evolving. What tools do you use, and what are their strengths and weaknesses?
freelancerlife
Freelancer life is wins, pivots, and everything in between. What’s yours right now?