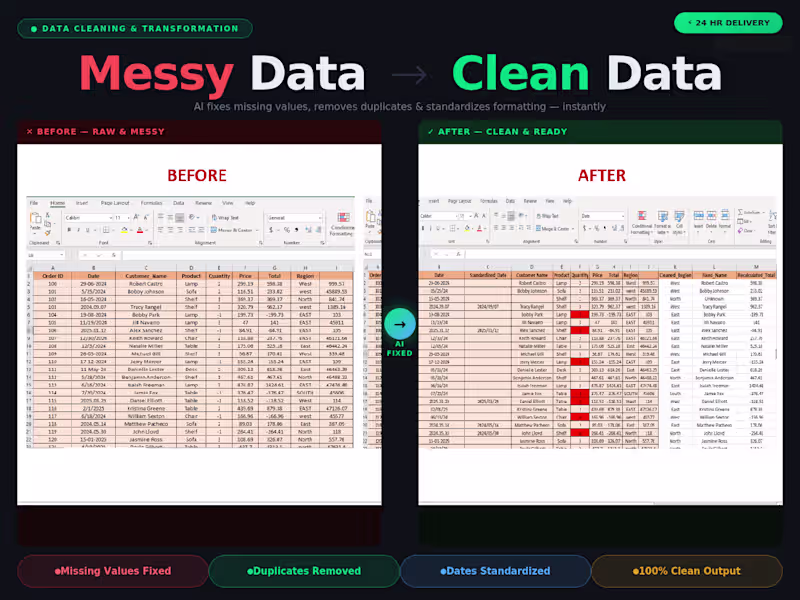
I build AI-powered data apps and dashboards
I build AI-powered data apps and dashboards
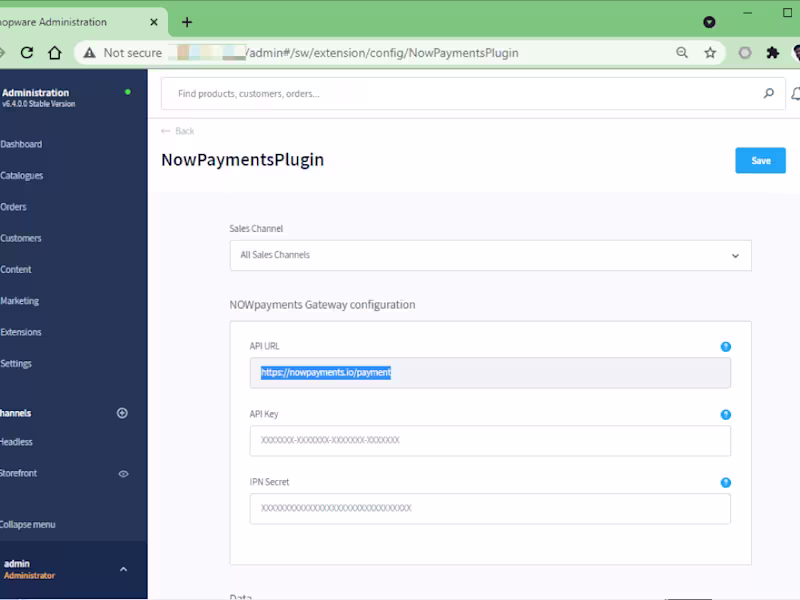
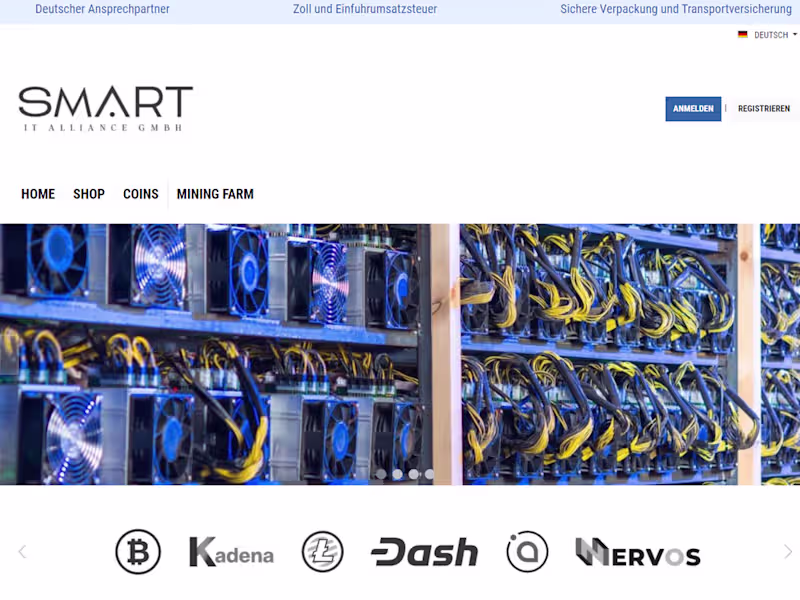
Shopware 6 Specialist | Full Stack Developer
Shopware 6 Specialist | Full Stack Developer

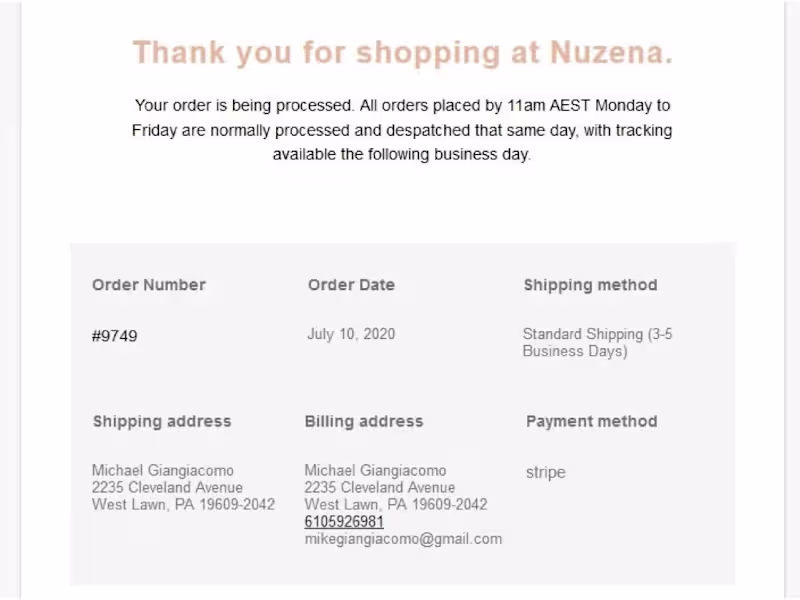
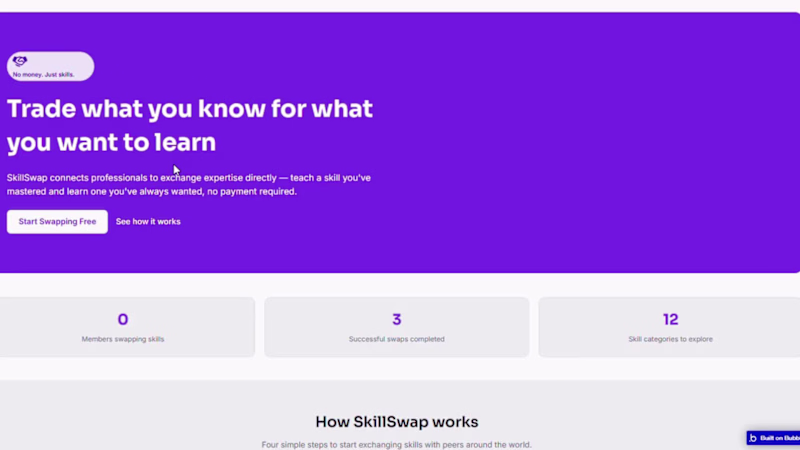
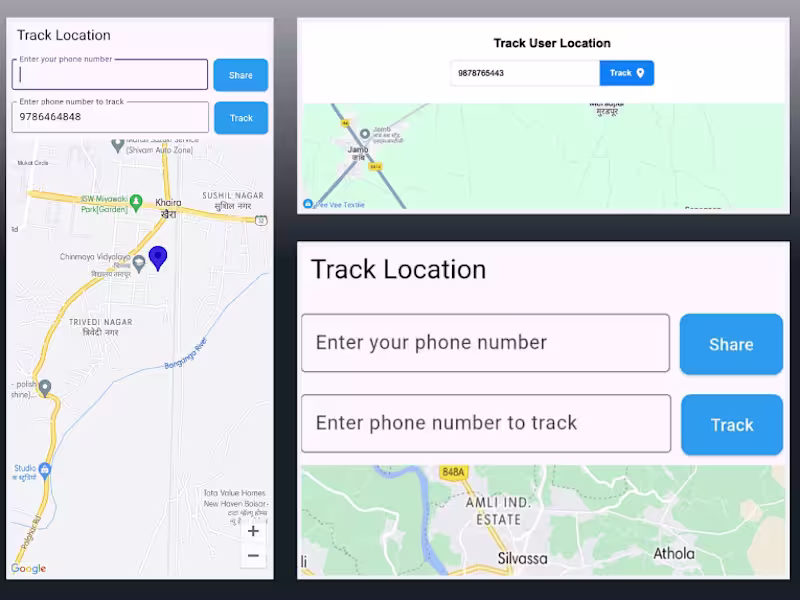
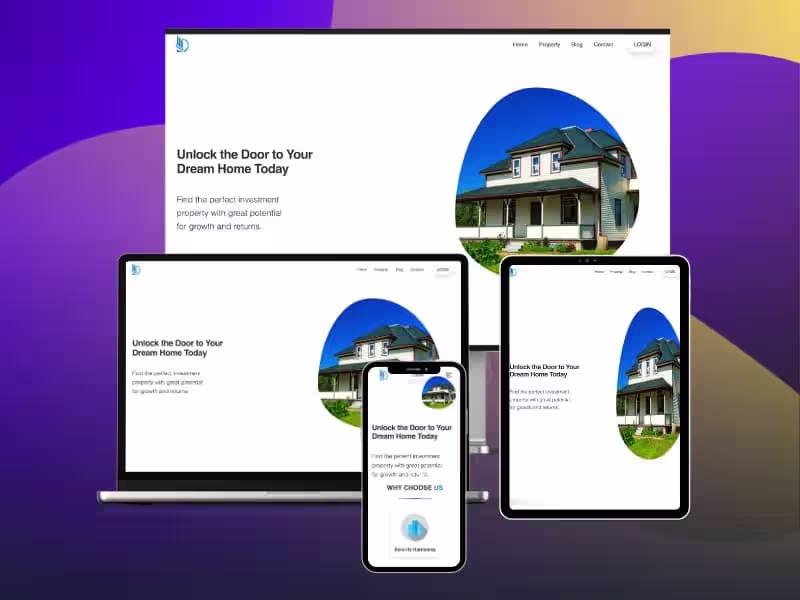
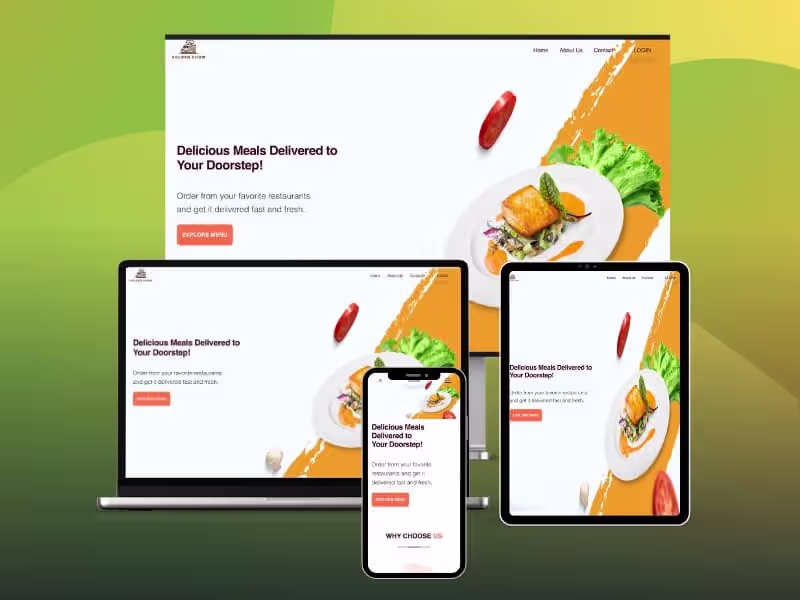
Full Stack Developer | Custom web & mobile app solution
Full Stack Developer | Custom web & mobile app solution
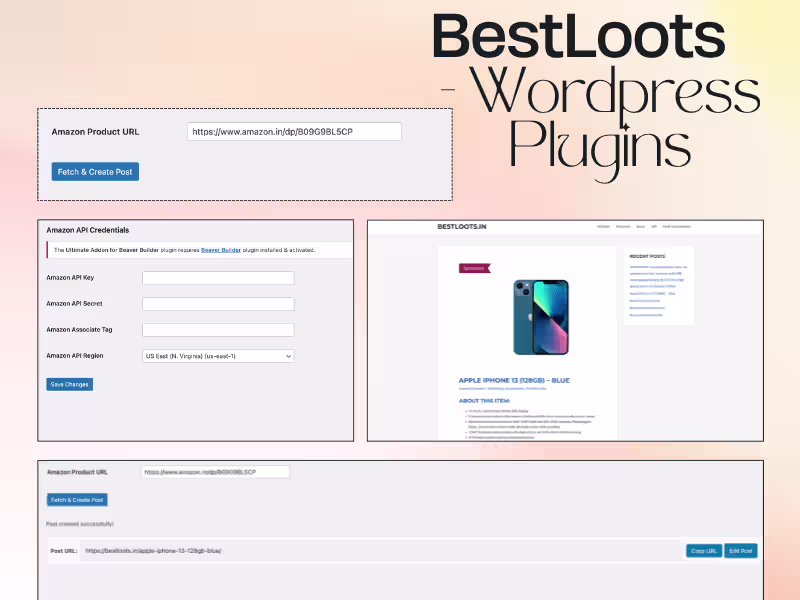
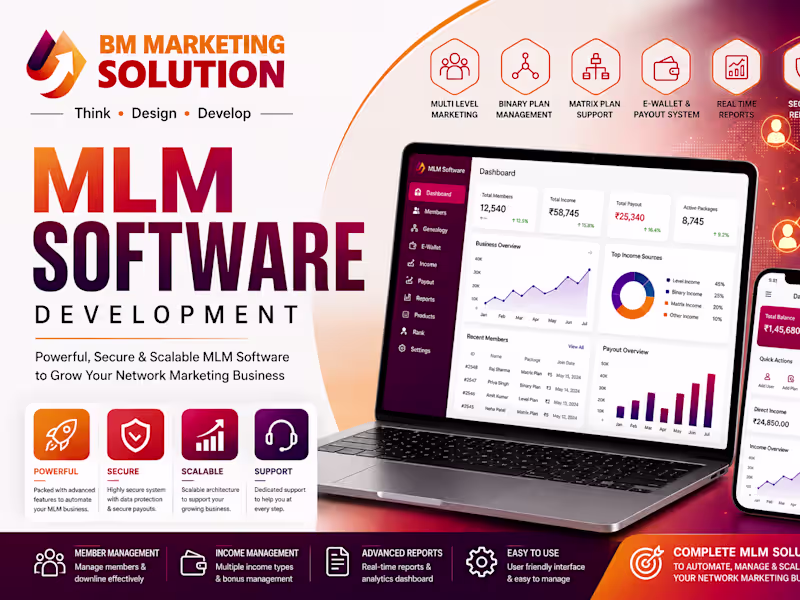
Full Stack Software Developer | Laravel Expert | CRM, MLM

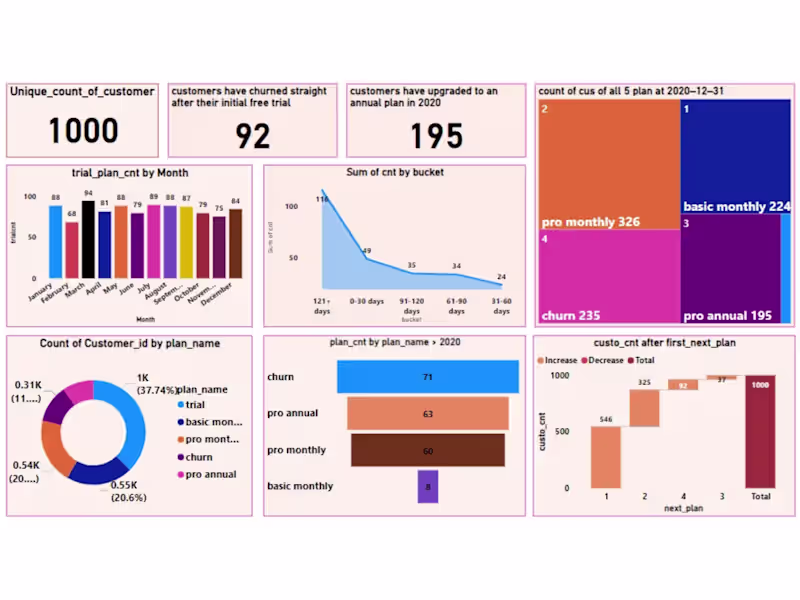
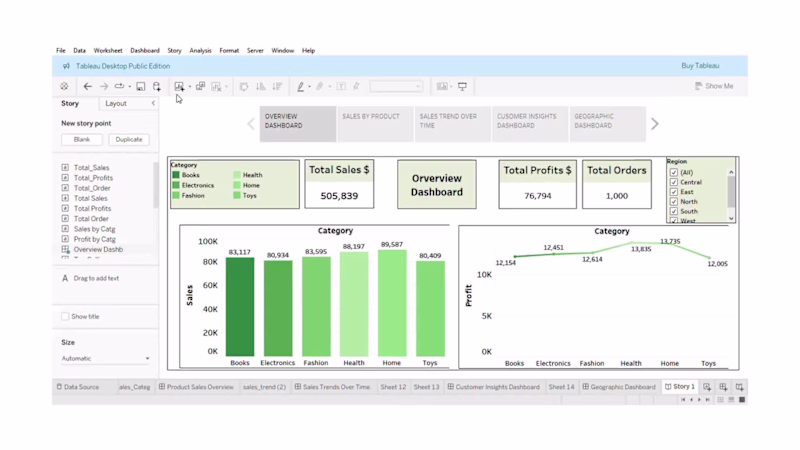
Senior Data Analyst | Business Intelligence Consultant
View more →
Fullstack Engineer with NodeJS & Fintech Exp
Fullstack Engineer with NodeJS & Fintech Exp


Ariston IT: Elevate Your Business with Custom Software
Ariston IT: Elevate Your Business with Custom Software


View more →
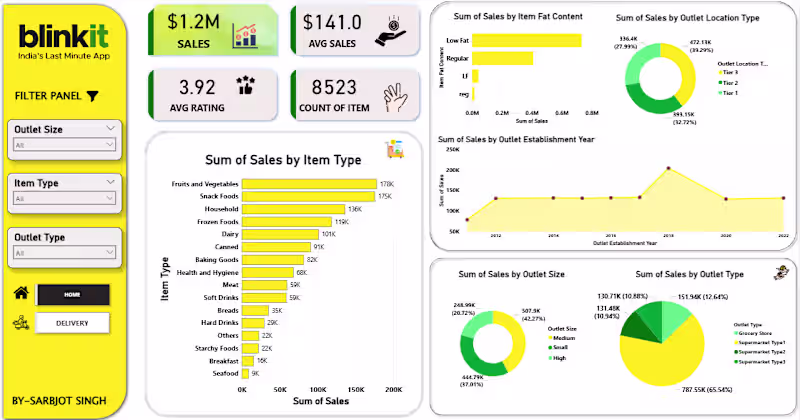
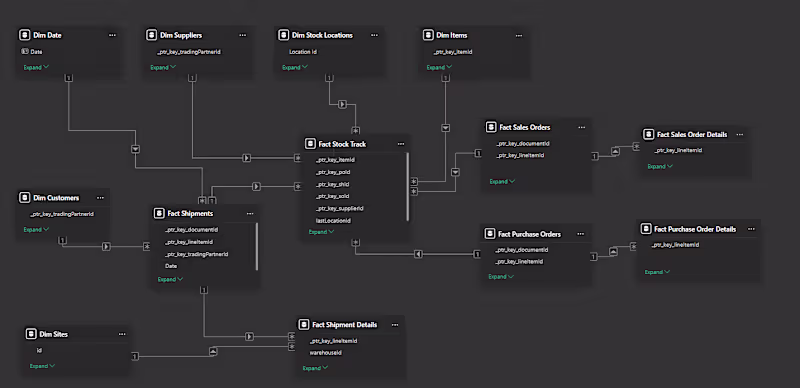
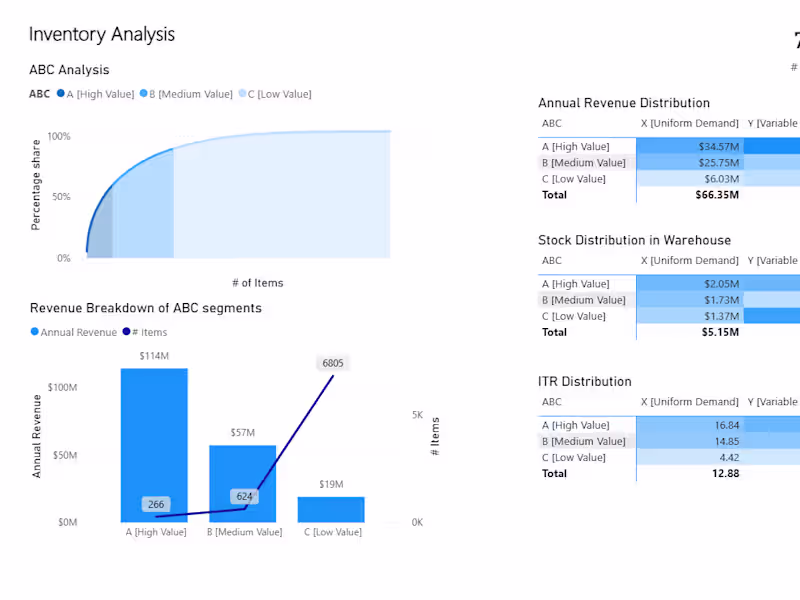
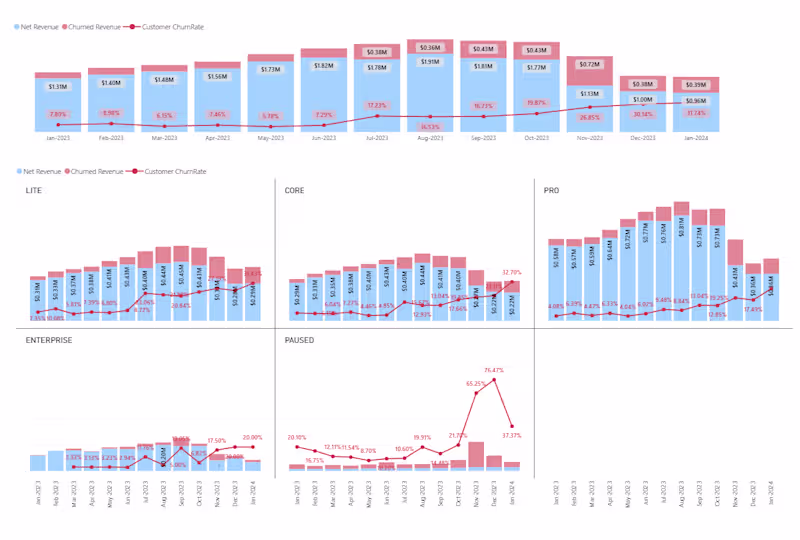
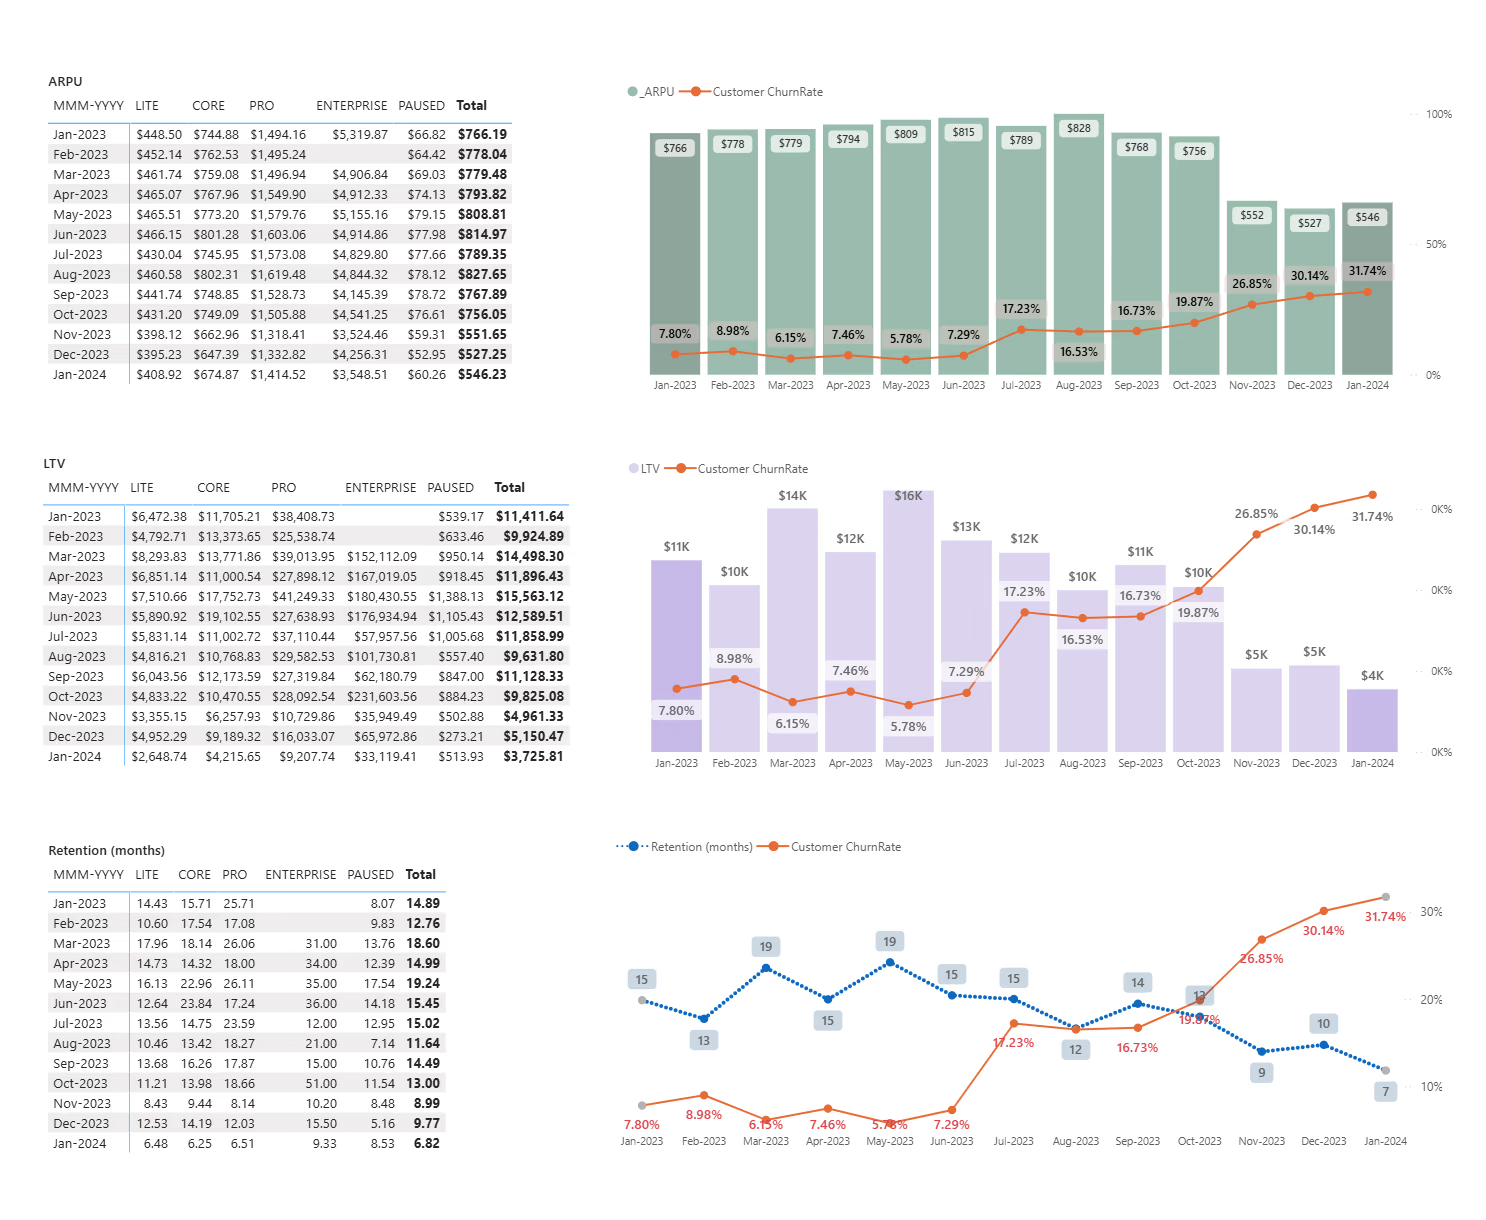
Power BI Expert | Turning Raw Data into Actionable Insights
New to Contra
Power BI Expert | Turning Raw Data into Actionable Insights