
AI Interface designer and developer.
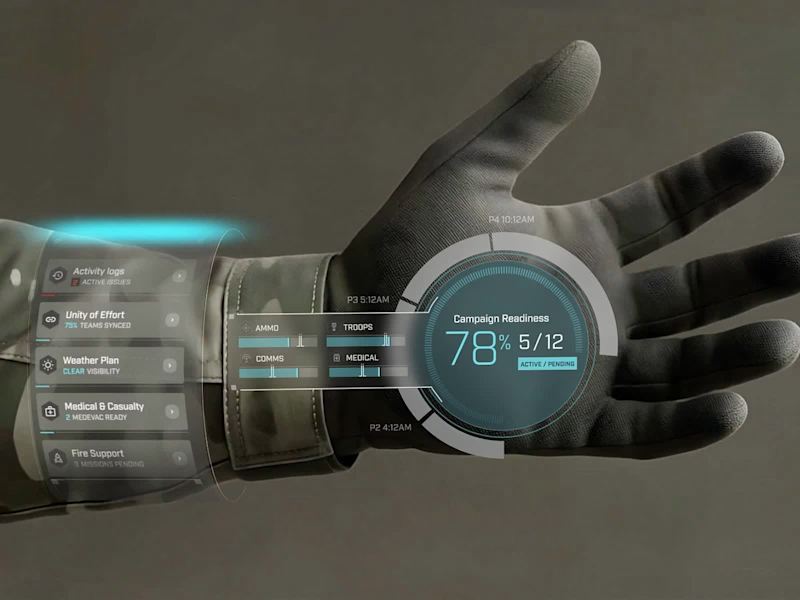
For this project, I had the chance to design a VR training system for soldiers, simulating real-world mission scenarios. My focus was on creating an interactive, efficient, and accessible experience, ensuring both learning effectiveness and user engagement.
Each screen was crafted to deliver essential information clearly and intuitively - from risk zone symbols to interactive mission progress charts. The integration of real-time feedback empowers soldiers to make swift tactical adjustments, ensuring quick decision-making during training.
This project blends cutting-edge VR technology with human-centered design, allowing soldiers to interact confidently with the system while preparing for any situation, all without the risks of traditional field training.
1
3
237
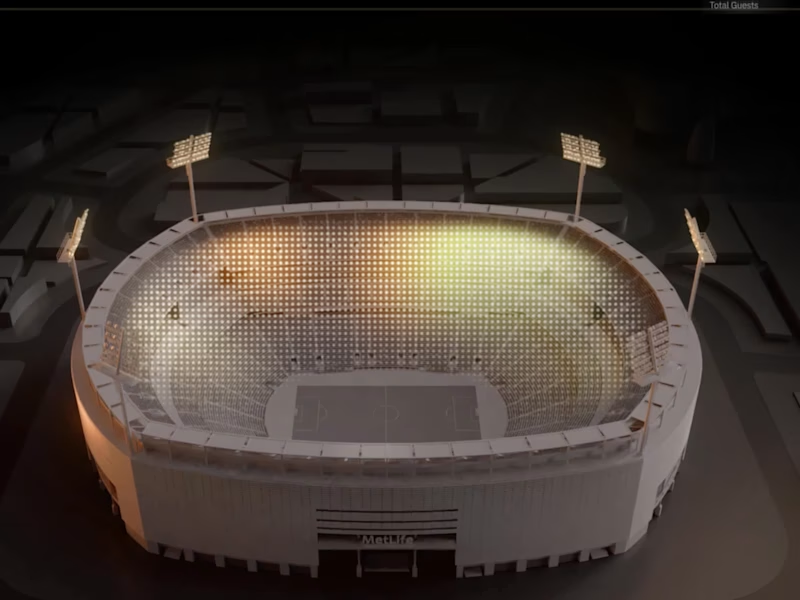
As a designer, I focused on crafting an experience that brings clarity to complexity. This project embodies the future of intelligent stadium management and sets a new standard in how we interact with data at scale.
This bird’s-eye view gives an effortless preview of how data flows across the venue, highlighting availability, network performance, and traffic patterns, helping managers ensure smooth operations for thousands of spectators.
Through motion-driven design, complex data is turned into meaningful insights. Dynamic, color-coded charts and intuitive visuals reduce cognitive load, offering clear, actionable information, like network status, crowd accessibility, and engagement - at a glance.
The real power of this animation lies in its ability to provide contextual insights at scale, enabling proactive decision-making.
2
2
218
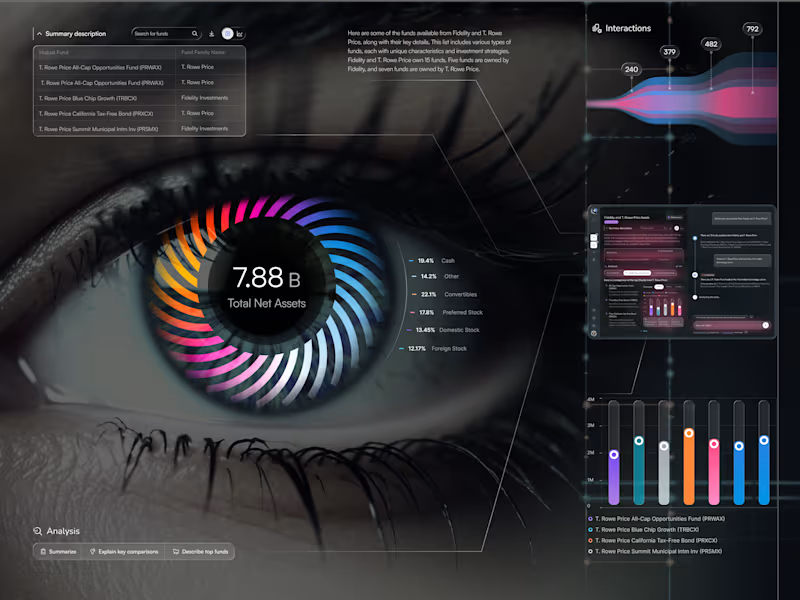
I’m excited to share EyeViz - a data-driven dashboard suite for exploring mutual funds through an artistic, human lens. ✨
👁️ Data You Can See (Eye Chart)
Meet the hero screen: a living iris where each colored blade maps an asset class, orbiting a bold KPI. It’s data-as-vision - instant clarity on allocation, balance, and momentum - with a slim Interactions stream and a built-in AI sidekick for quick explanations.
💡 Research Workspace
Search, compare, and understand — fast. Clean tables, smart chips, and a compact chart show stability, income focus, diversification, and risk side-by-side. The chat panel flags Unverified insights so trust stays front and center.
📱 Personal Workspace
Your everyday hub: activity tiles, pinned studies, and ongoing team chats - so you can jump back into work in seconds and keep insights reusable.
1
155
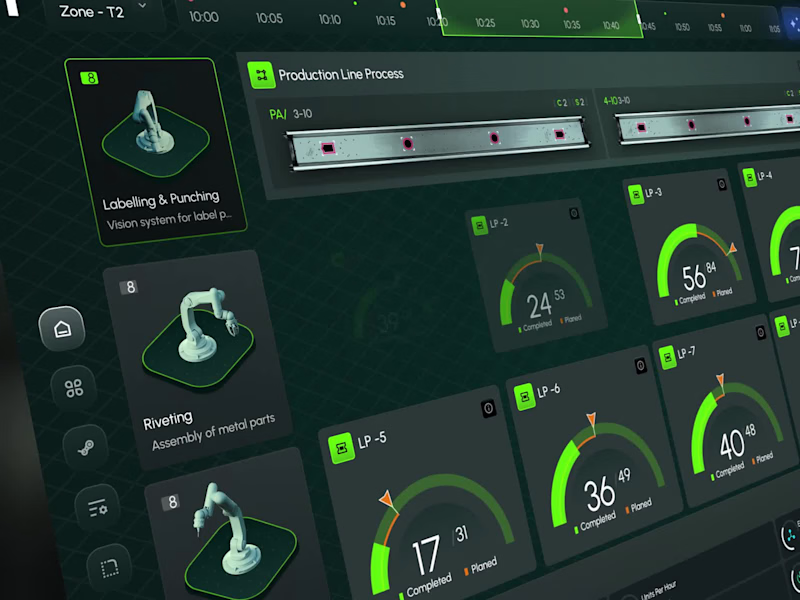
An animated interface designed to reflect the precision of industrial intelligence - a sleek, high-level dashboard built to orchestrate robotics, production analytics, and system-wide monitoring. From robot status indicators to real-time task flow and factory zone mapping, every visual layer is crafted for engineers who demand clarity at a glance and precision at scale.
Instant visibility across all production zones
Seamless integration of robotic systems
Performance insights delivered live
Designed for decisions - not just data
Welcome to the new standard in industrial UX: fast, focused, and fully connected.
22
375

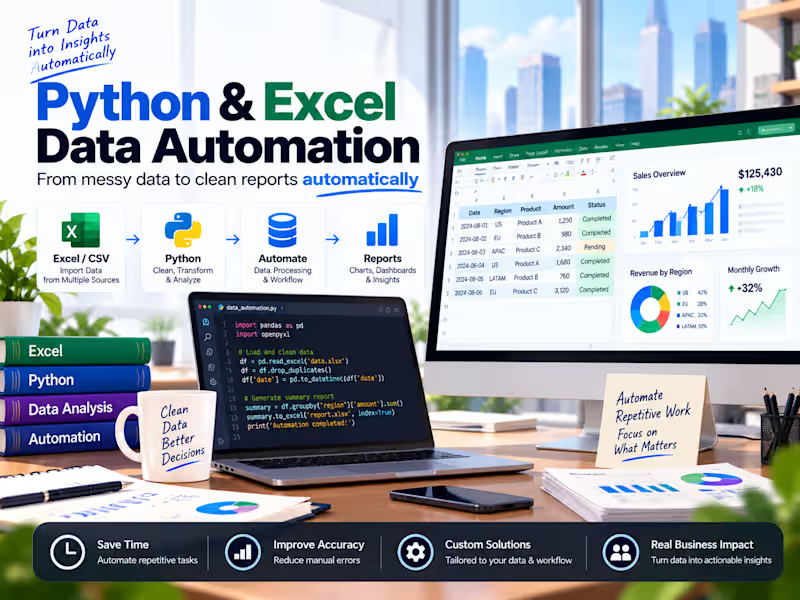
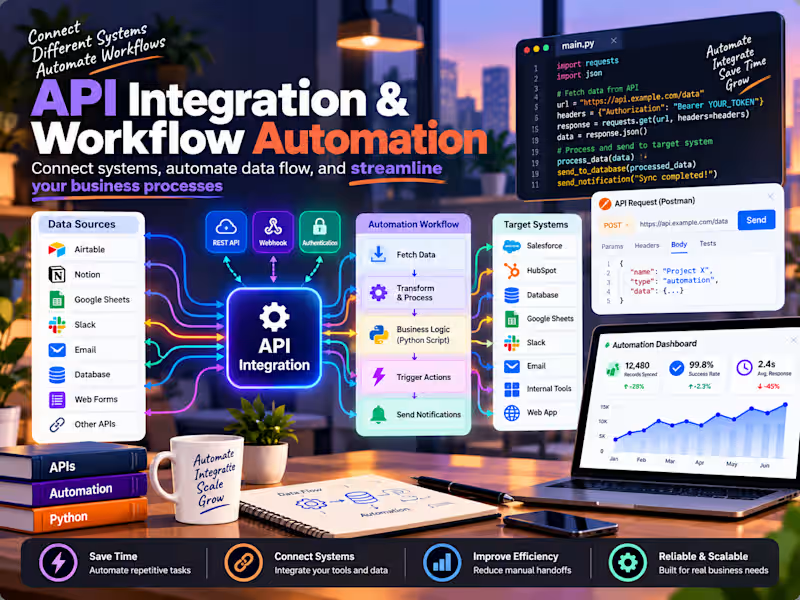
Workflow automation for forms, CRMs, Zapier, Make, n8n.
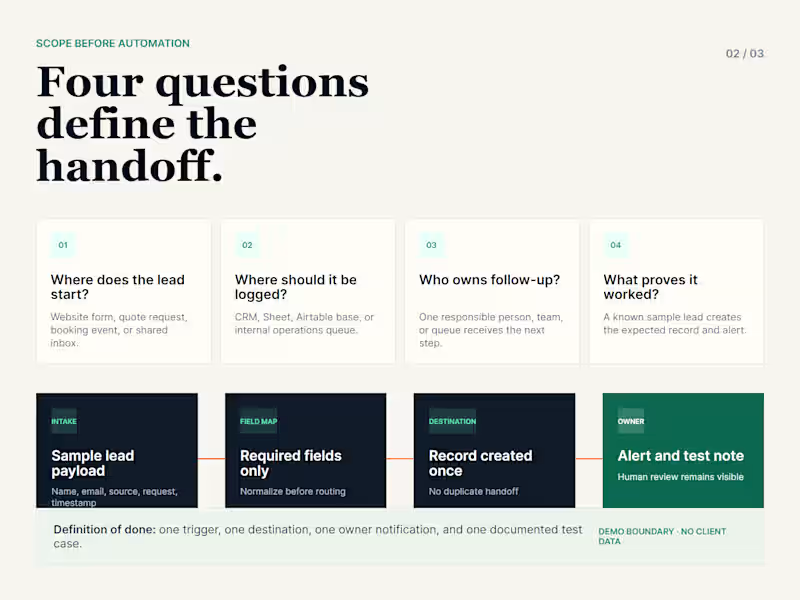
A self-initiated workflow automation demo showing a simple lead handoff: intake, routing, CRM or sheet logging, owner notification, and test-ready review output.
0
85
Self-initiated internal product. Odds Desk uses public data only. It is not client work, a trading tool, or financial advice.
I built this because a research brief is only as trustworthy as the source snapshot behind it. Catalog freshness, derived summaries, file identity, and editorial status need to stay consistent across every generated artifact.
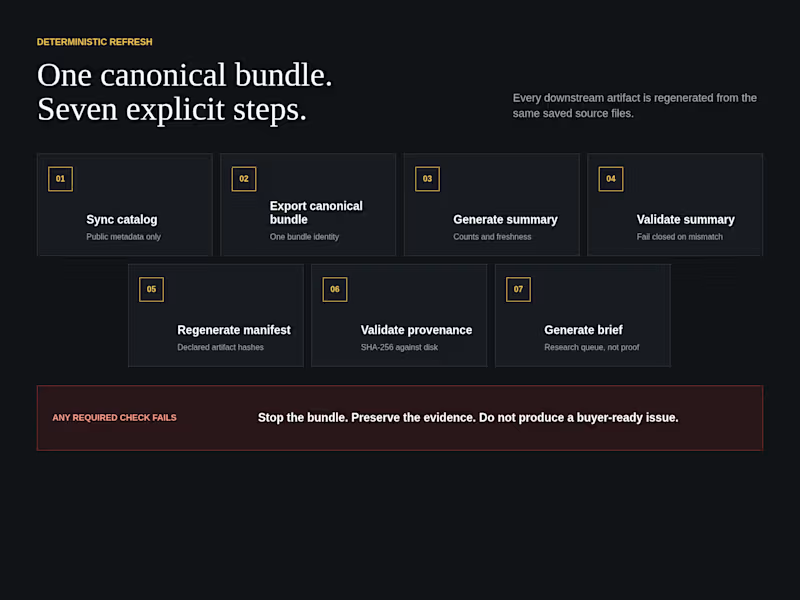
The workflow synchronizes a public catalog, exports one canonical bundle, generates and validates a summary, regenerates a manifest, checks declared SHA-256 values against disk, and produces a dashboard and Markdown brief from the same saved files.
The workflow fails closed. If a required validation fails, the bundle stops, the evidence is preserved, and no buyer-ready issue is produced.
The gallery shows a July 30, 2026 snapshot with 675 saved markets, 36 unverified research leads, zero verified cards, and four of four declared hashes matching disk. The state remains RESEARCH_PREVIEW.
Best fit: public API ingestion, reproducible research bundles, validation pipelines, provenance checks, fail-closed editorial workflows, and automated briefing systems.
0
82
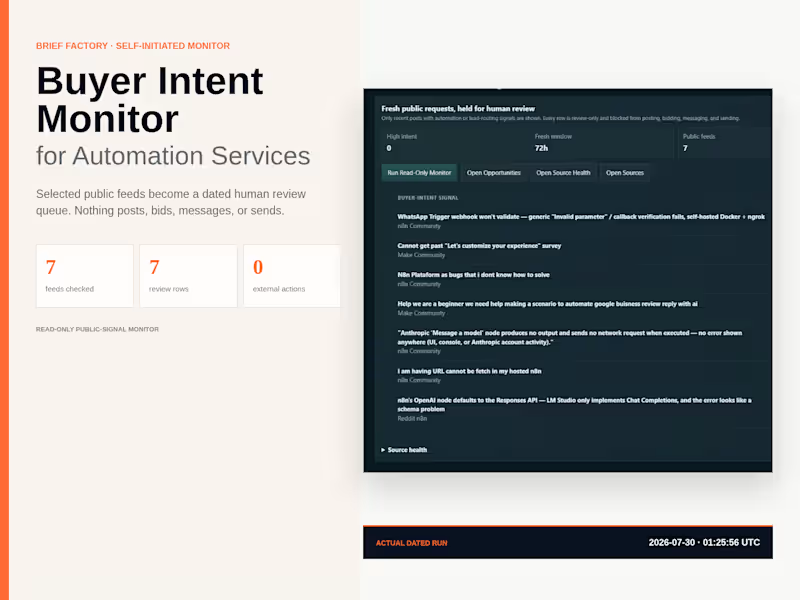
A self-initiated Brief Factory internal system. The gallery shows public post titles only. No names, handles, contact details, or private messages are shown.
I built this to make public automation research more consistent. Instead of manually checking communities for scattered requests, the monitor reads selected RSS and Atom feeds, normalizes source URLs, rejects stale or generic items, scores observable workflow pain, deduplicates accepted rows, and records source health.
The output is a structured review queue, not permission to contact anyone. The system does not post, bid, message, or send.
The gallery shows a dated run from July 30, 2026: seven configured feeds, seven review rows, two HTTP 429 rate limits, zero high-intent rows, and zero external actions authorized.
Best fit: public-source monitoring, qualification queues, source-health reporting, research triage, and review-first opportunity workflows.
0
91

Automating the boring stuff = better work/life balance.
- $5k+
- Earned
- 2x
- Hired
- 2
- Followers
Automating the boring stuff = better work/life balance.


View more →

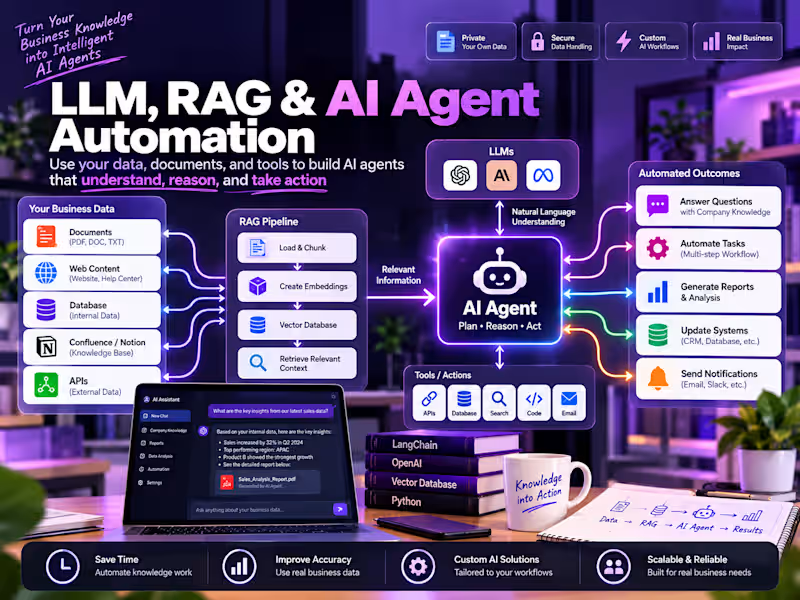
AI Automation for Support & Ops | Chatbots, Workflows

Business Writing: Storytelling for Success

Building Tomorrow.
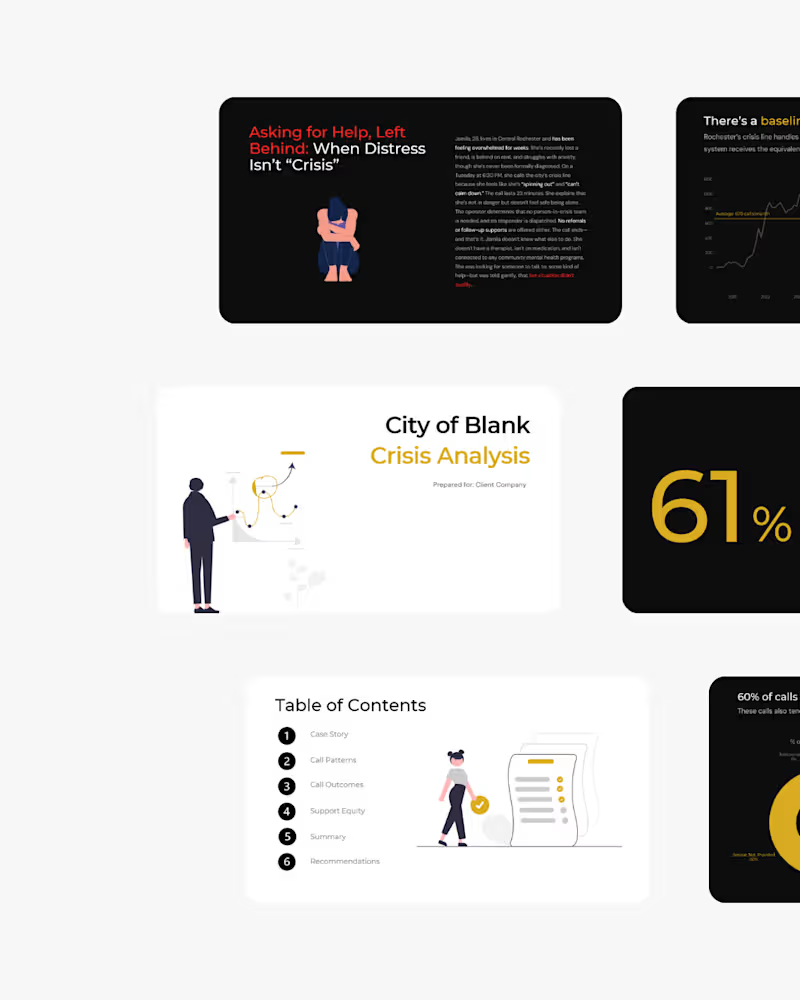
Infrastructure isn’t just roads and bridges, it’s how a city responds in its most critical moments. Honored to have analyzed Rochester’s crisis systems to help build a more responsive, intentional future for all.
2
5
308



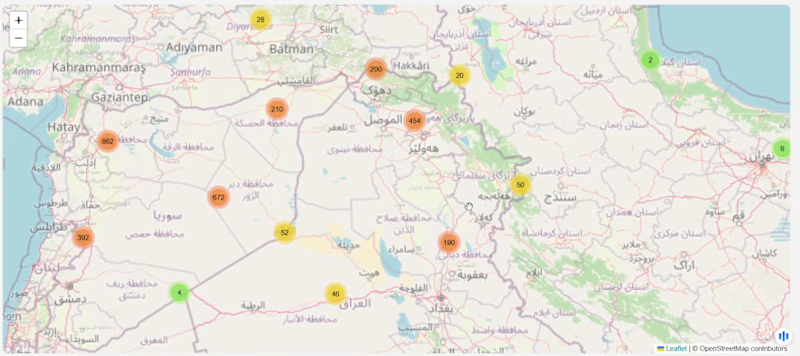
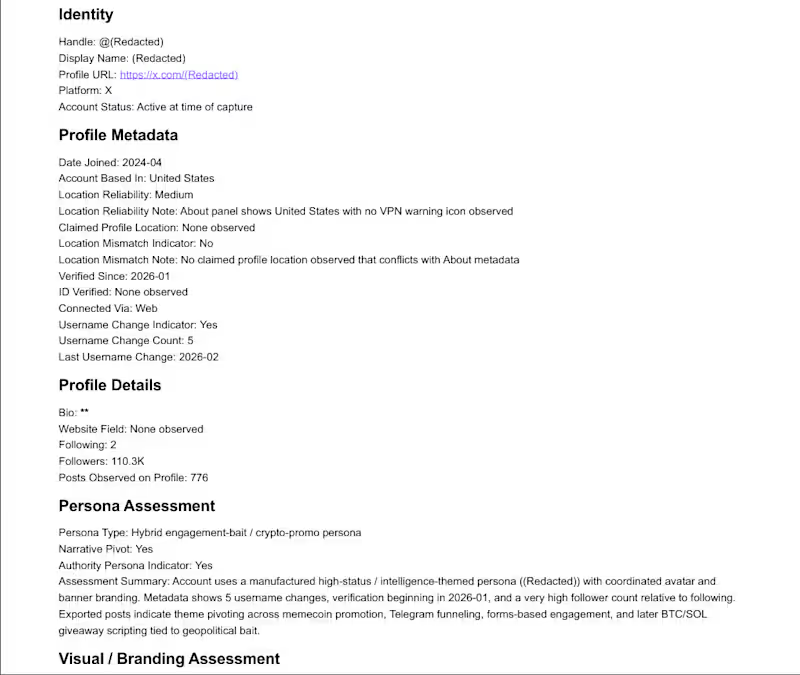
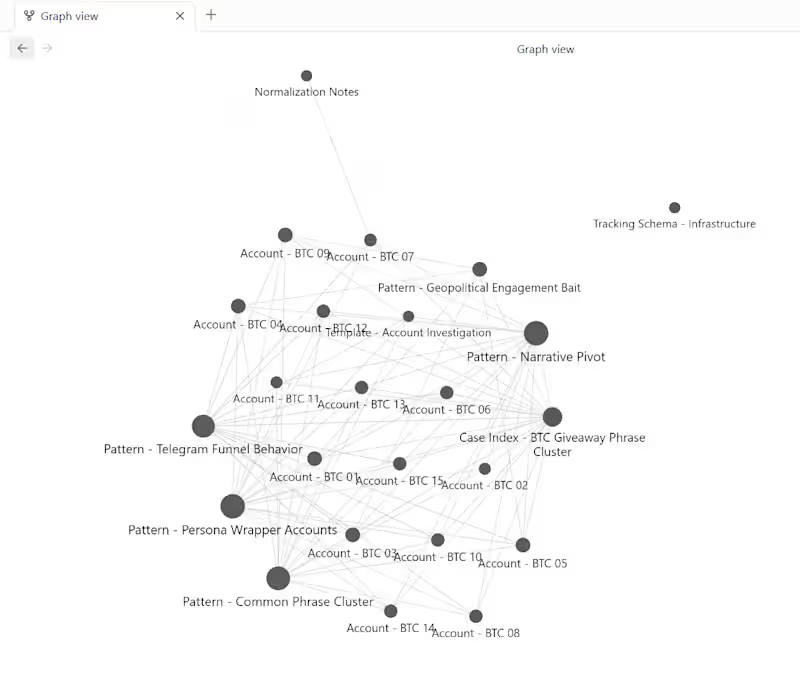
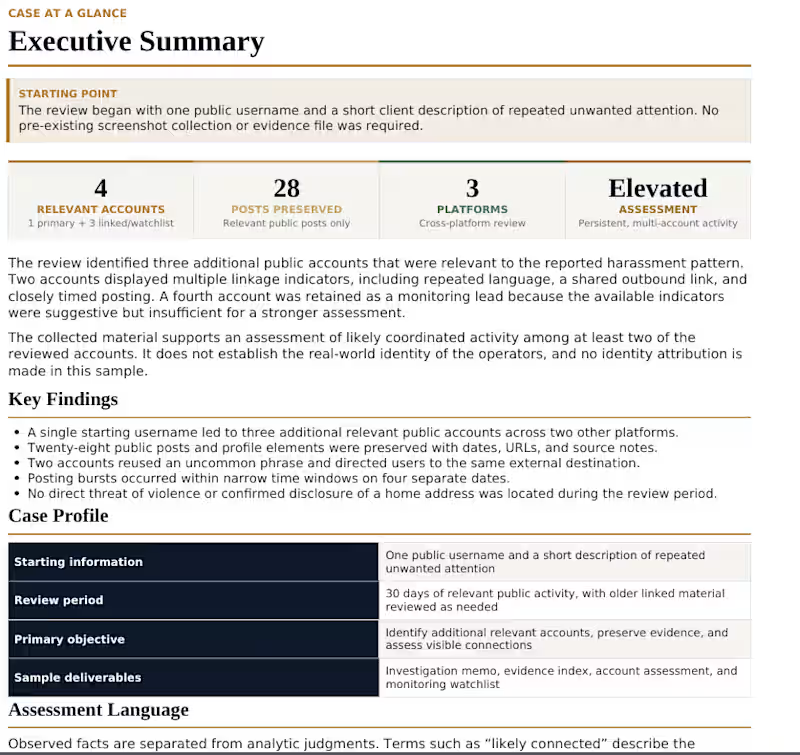
Research and Investigation support, Online Harassment Triage
Research and Investigation support, Online Harassment Triage

Data Analytics & BI Consulting for Gov, Higher Ed, Finance
New to Contra
Data Analytics & BI Consulting for Gov, Higher Ed, Finance
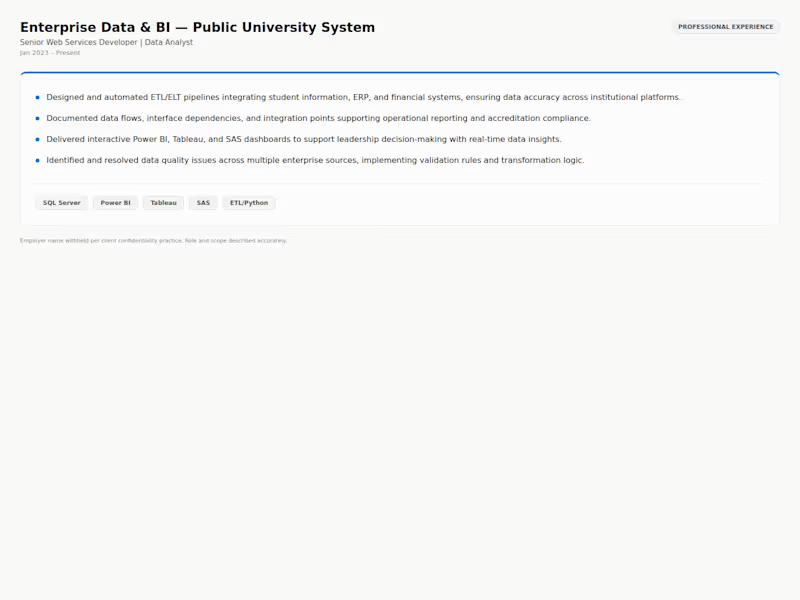
Enterprise Data & BI — Public University System. Real professional experience (employer name withheld per confidentiality practice): built ETL/ELT pipelines integrating SIS, ERP, and financial data, and delivered Power BI/Tableau/SAS dashboards for institutional leadership.
0
23
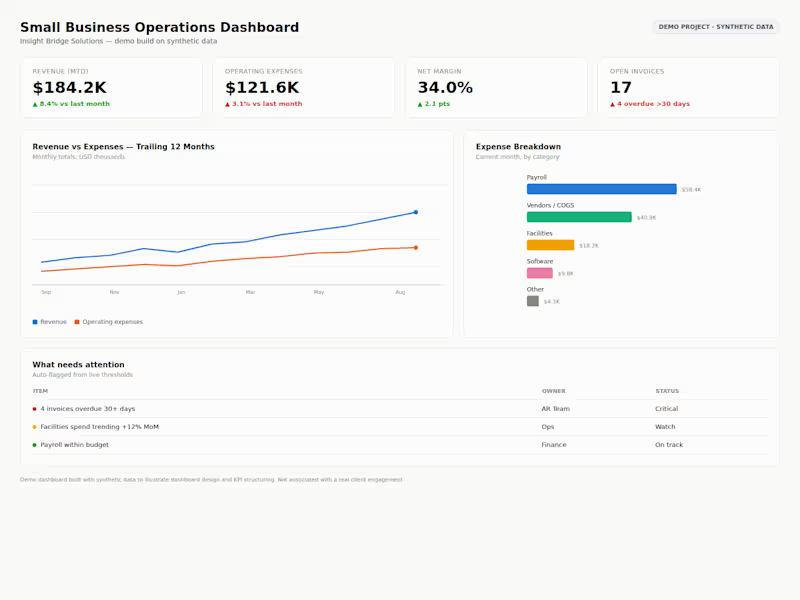
Small Business Operations Dashboard — a demo Power BI–style build on synthetic data showing the three questions every dashboard should answer: what needs attention, who owns it, what's overdue. KPI cards, a 12-month revenue vs. expense trend, expense breakdown, and an auto-flagged action list.
0
19
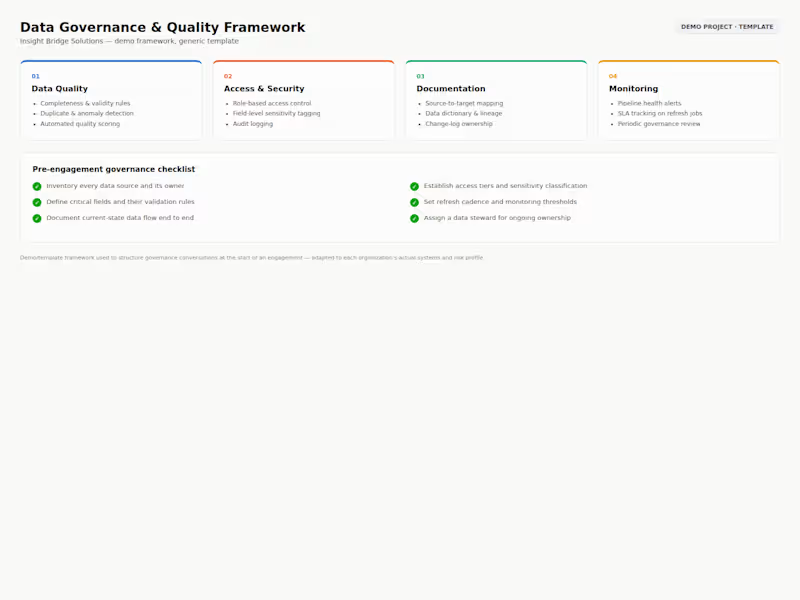
Data Governance & Quality Framework — a demo template I use to structure governance conversations at the start of an engagement: four pillars (data quality, access & security, documentation, monitoring) plus a pre-engagement checklist. Built on synthetic/generic data to show documentation style, not tied to a specific client system.
0
28
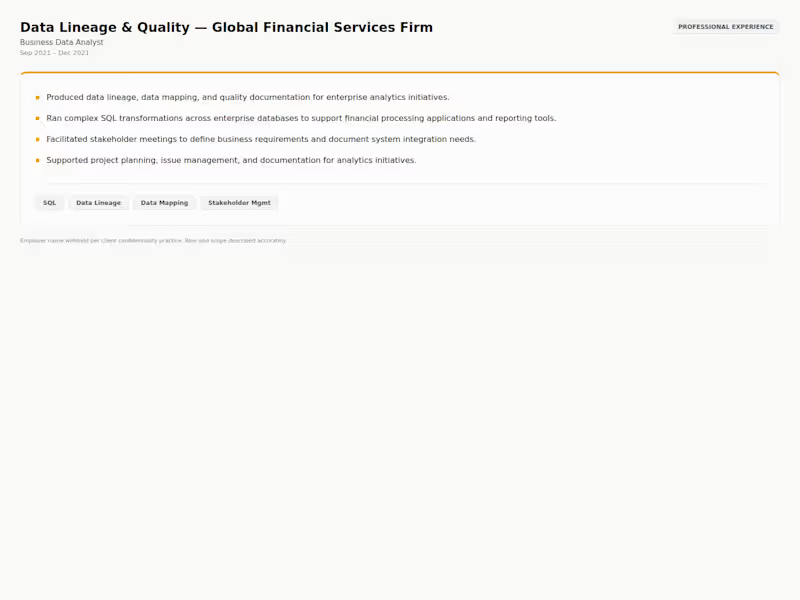
Data Lineage & Quality — Global Financial Services Firm. Real professional experience (employer name withheld per confidentiality practice): produced data lineage, mapping, and quality documentation for enterprise analytics initiatives, ran complex SQL transformations supporting financial processing and reporting tools, and facilitated stakeholder meetings to define business requirements.
0
39