Data Visualization Projects in Karnataka
Data Visualization Projects in Karnataka
Sign Up
Post a job
Sign Up
Log In
Filters
2
Projects
People
Message
0
Sparsh Gupta
pro
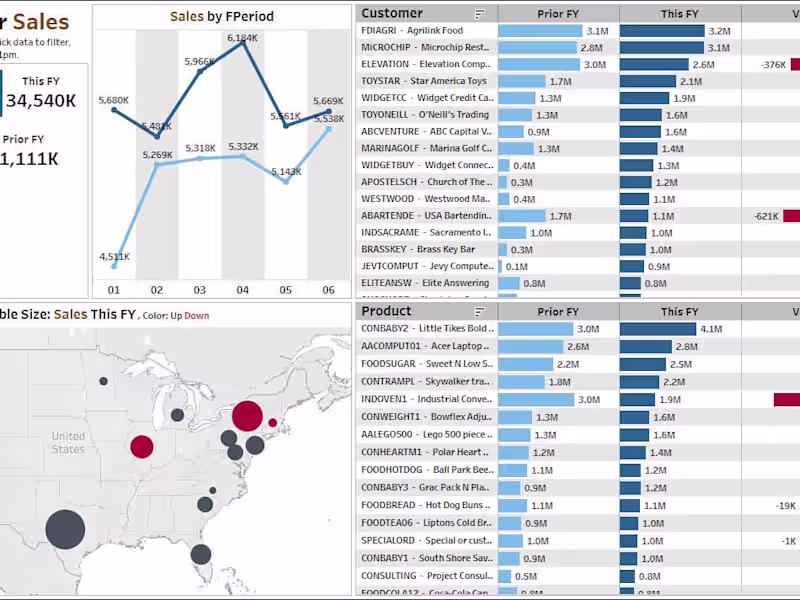
Tableau Pricing Tool for Sales Team
0
20
Message
0
Priyank Agarwal
pro
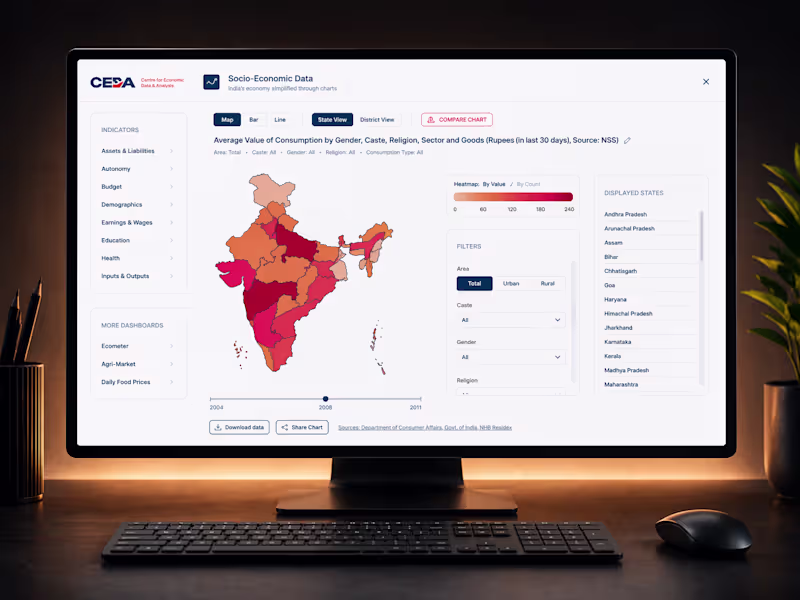
Economic Dashboards for Ashoka University
0
0
Message
0
Aditya Singh
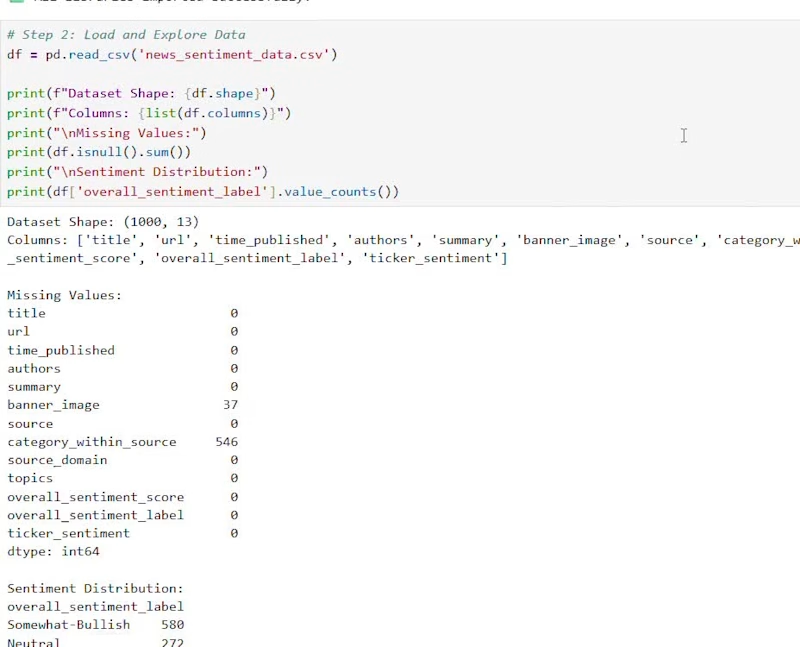
Role: AI Automation Developer Description: Developed an automated system to process and analyze 1,000+ financial news reports using Natural Language Processing (NLP). The system performs sentiment-based investment scoring, allowing for rapid decision-making in volatile markets. Tools: Python (NLTK, Pandas), Jupyter Notebook. Impact: Reduced manual analysis time by 90% through automation.
0
27
Message
0
Varun Walekar
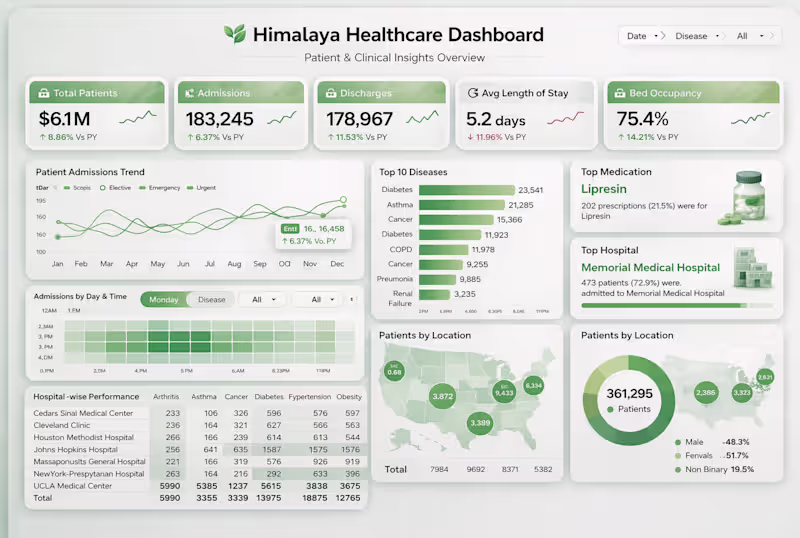
From Chaos to Clarity: Healthcare Dashboard in Power BI 1. Clean and interactive Power BI dashboard for tracking patient trends, hospital performance, and key healthcare metrics in one place. 2. A modern healthcare analytics dashboard built in Power BI to monitor admissions, diseases, and operational efficiency. 3. Turn raw healthcare data into meaningful insights with this intuitive and fully interactive Power BI dashboard.
0
46
Message
0
Kinshuuk Bose
pro
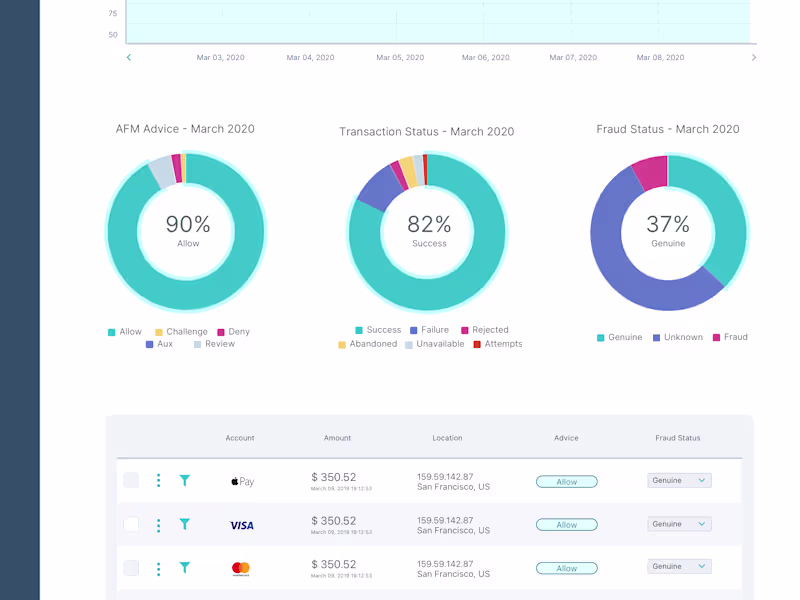
One Portal: Building EAM
0
3
Message
0
Prakash Anand Kolkundi
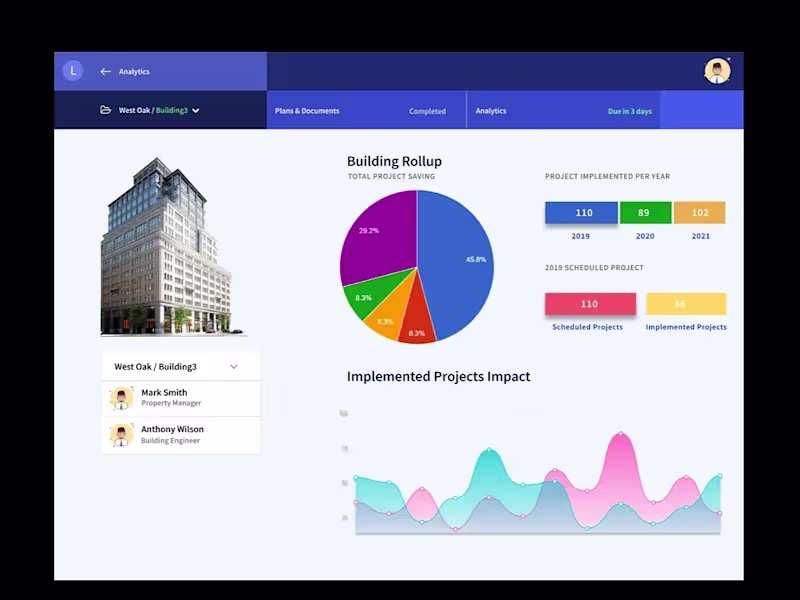
Analytics Dashboard
0
72
Message
0
ananya shetty
Performance Report Plant_DTS Project
0
4
Message
1
Kavyashree Sanjakadavu
Mental Health Data Analysis Interactive Dashboard
1
2
Message
0
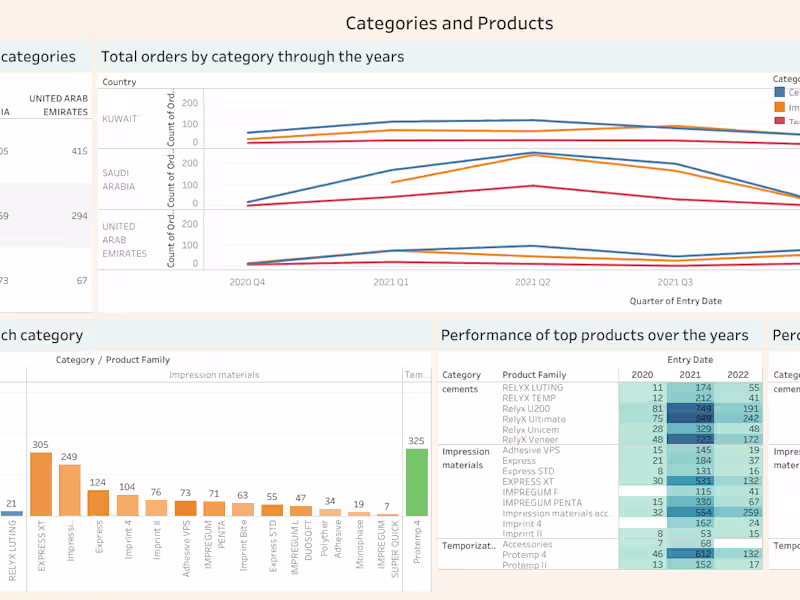
Srijan Devnath
Products and Categories Analysis
0
19
Message
0
Akash Bisht
Healthscore Experience and Wellness Consultations
0
0
Message
0
Vinay Narasimhamurthy
pro
Merchant POS Application
0
3
Message
0
Narayanan M
COVID-19 Data Analysis Using Python
0
2
Message
0
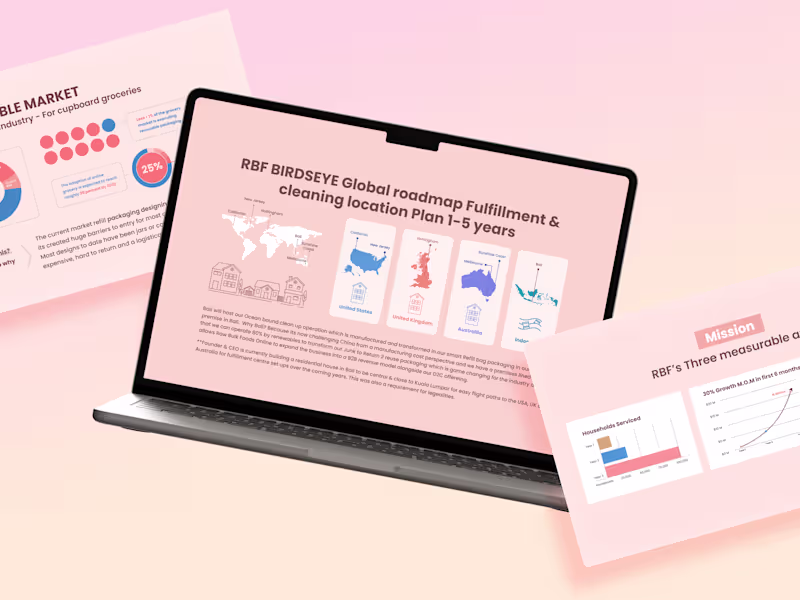
Yashodhara Sikarwar
Presentation Designs using Infographics on Behance
0
7
Message
0
Anirudh akhil
I will custom thankyou cards for every occasion in 1 hour
0
18
Message
0
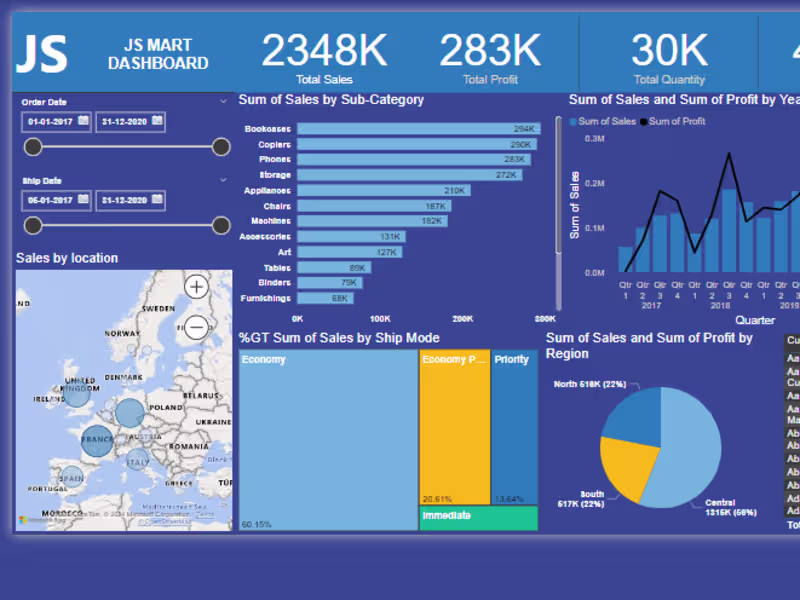
Jacob Stephen
Power BI Dash Board JS Mart, Example
0
10
Message
0
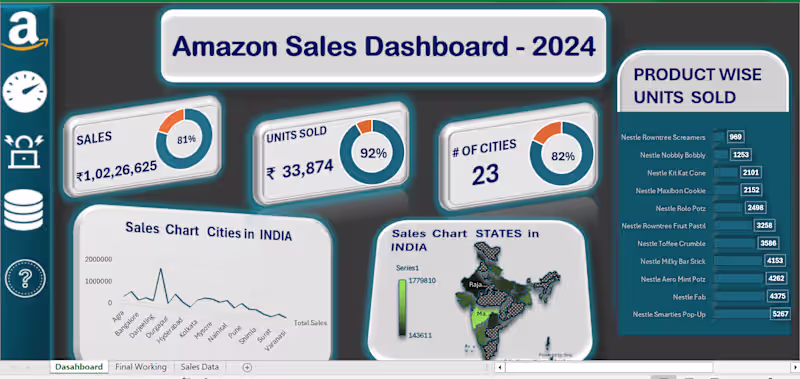
BALA JESS
AMAZON SALES DASHBOARD
0
6
Explore projects