Products and Categories Analysis
Srijan Devnath
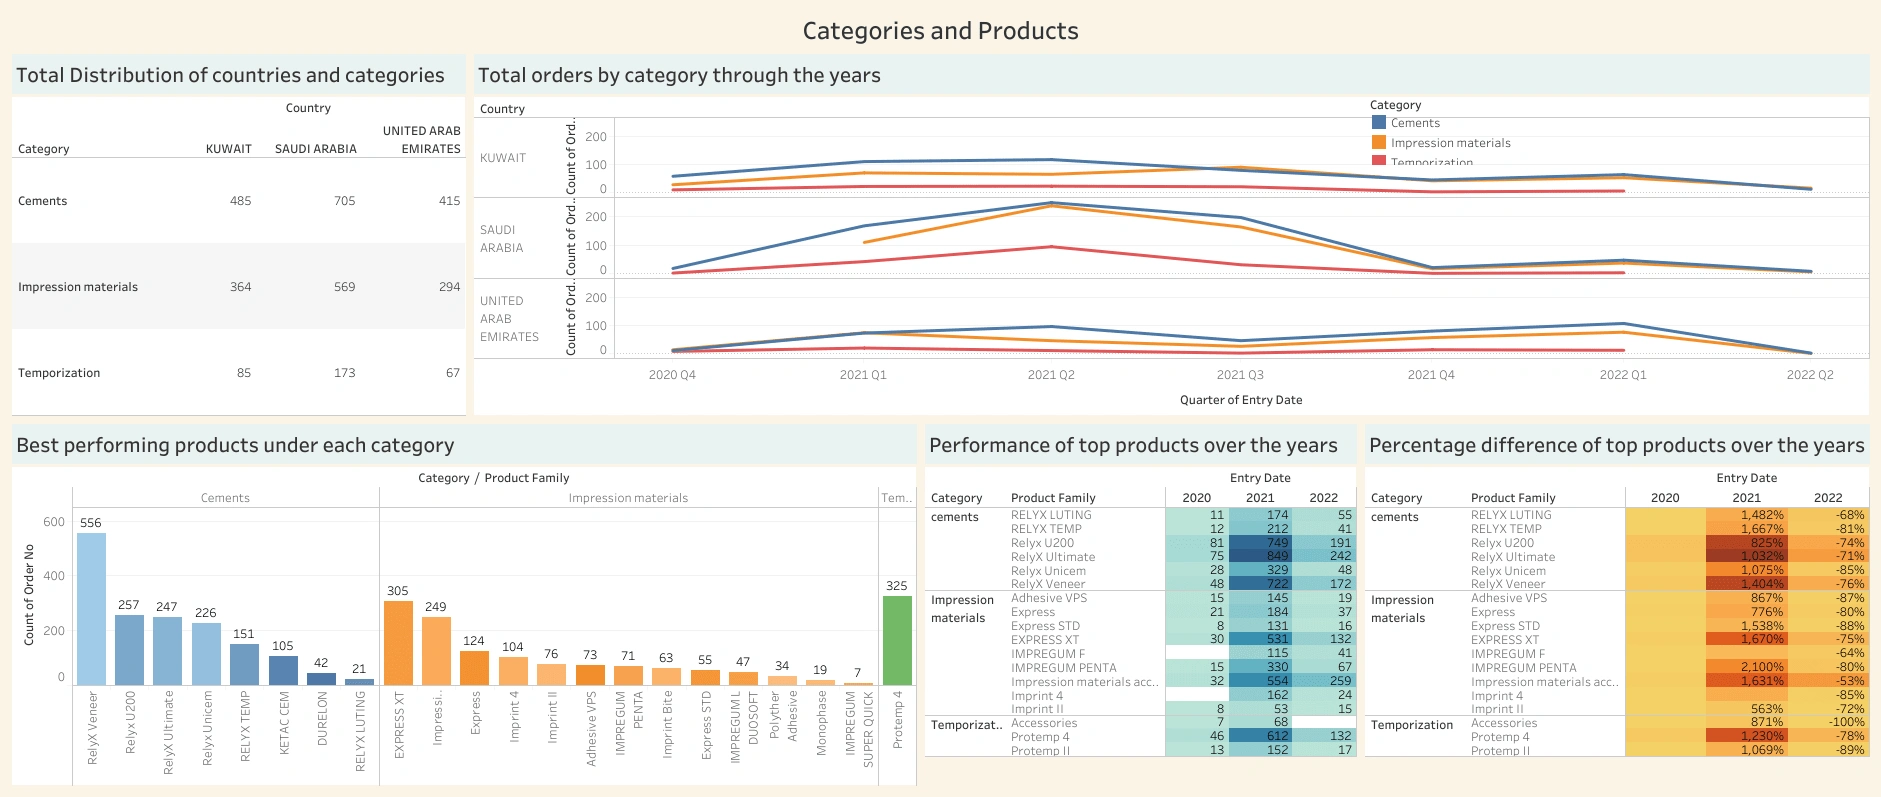
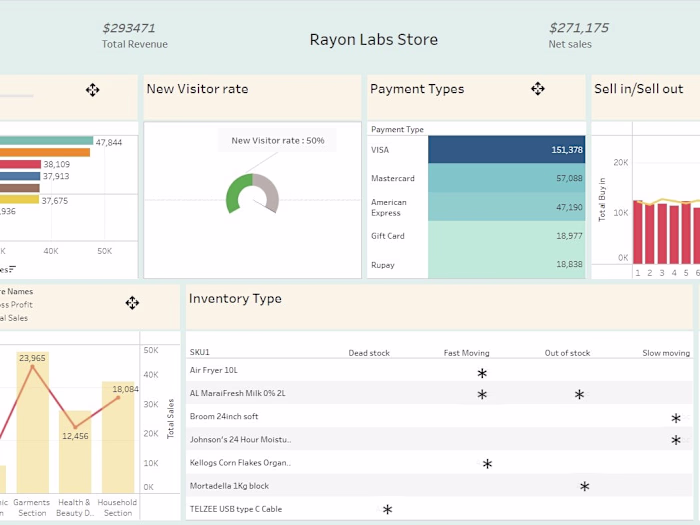
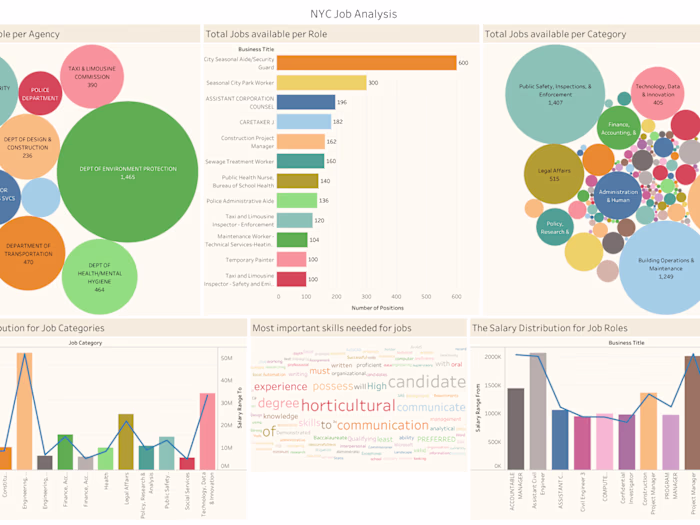
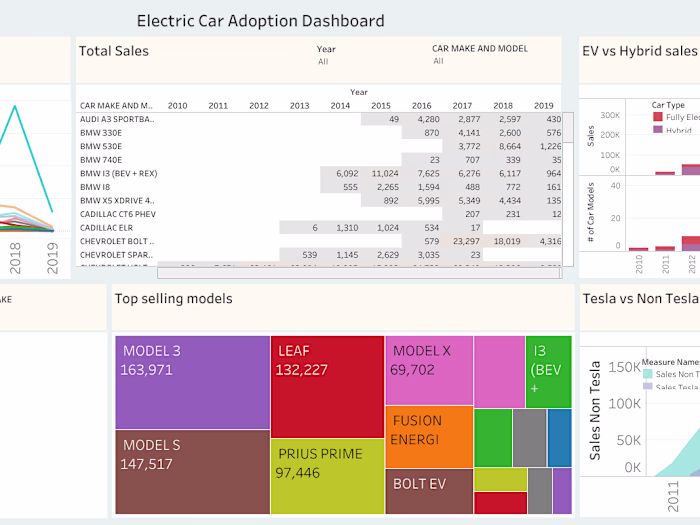
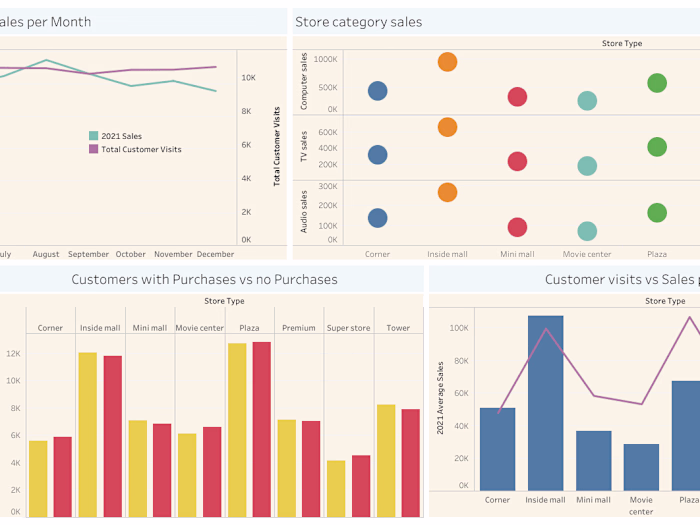
The dashboard created for the project
Overview
This project involved analyzing different best selling products under their respective categories for a consulting agency operating and managing in different markets.
Process
Extracted data from live servers hosted on Azure
Cleaned data using Excel and Python using different data cleaning techniques
Narrowed down the top 3 most important regions of sale
Performed EDA and feature importance to analyze according to the regions
Created visualizations to highlight questions and parameters
Compiled a dashboard to finalize the analysis and results
Output
The final output was given to the client in the form of a Tableau workbook containing visualizations and dashboard and a word document containing analysis and insights
Like this project
Posted Nov 30, 2022
Analyzed a suite of products under different best selling categories for a consulting agency
Likes
0
Views
20