AI Integration & Automation Engineer | Full-Stack Web Apps
AI Integration & Automation Engineer | Full-Stack Web Apps

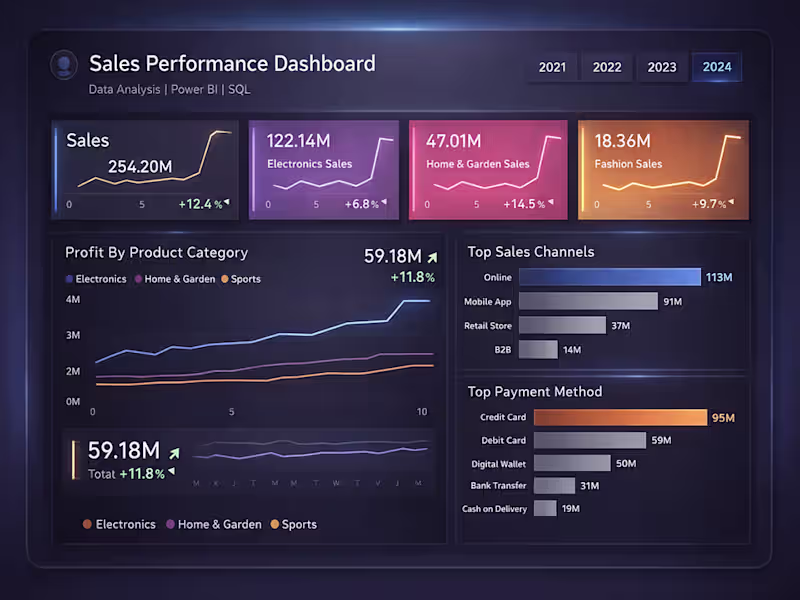
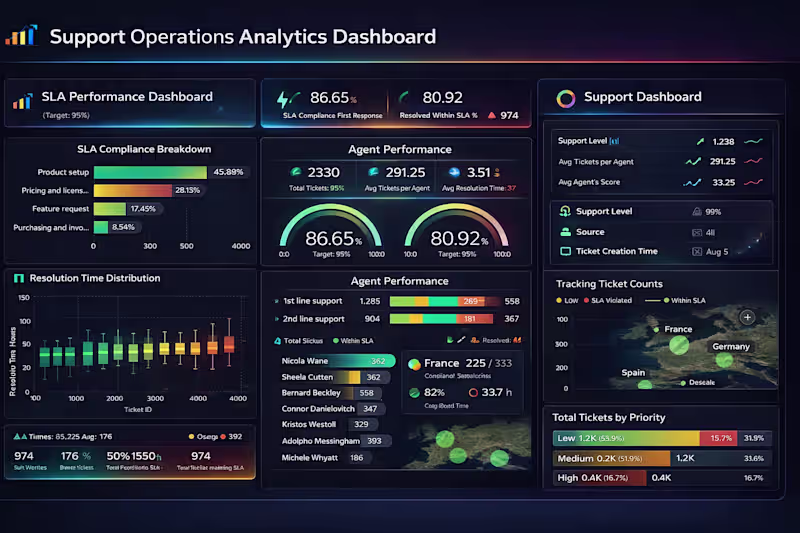
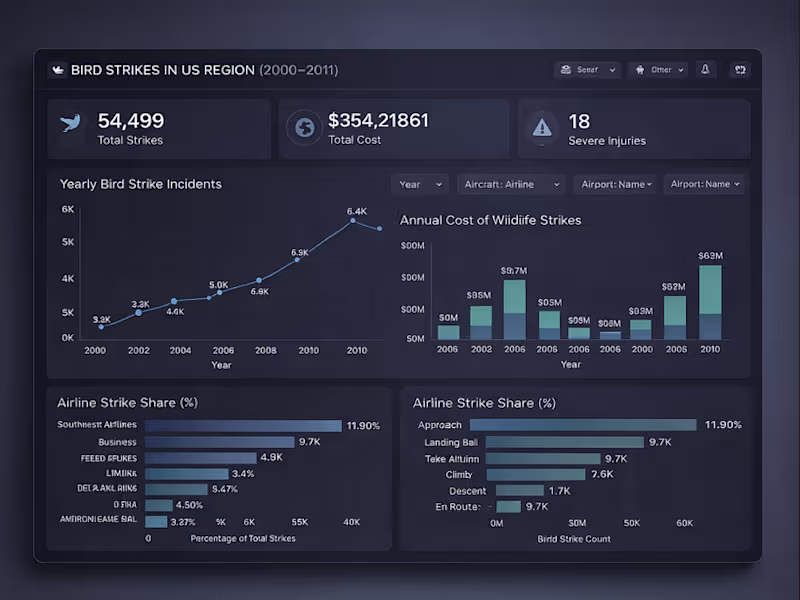
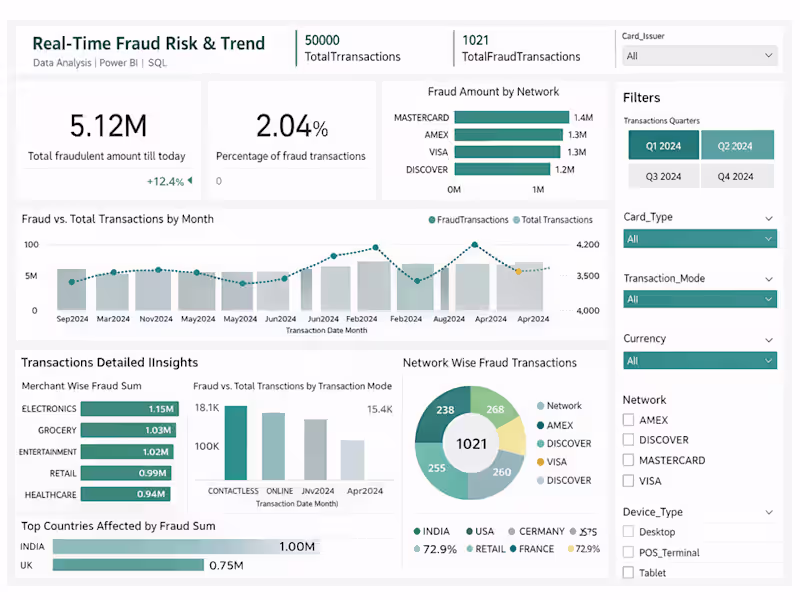
Data Analyst | Power BI & SQL Dashboard Expert
Data Analyst | Power BI & SQL Dashboard Expert
Strategist by training, builder by instinct
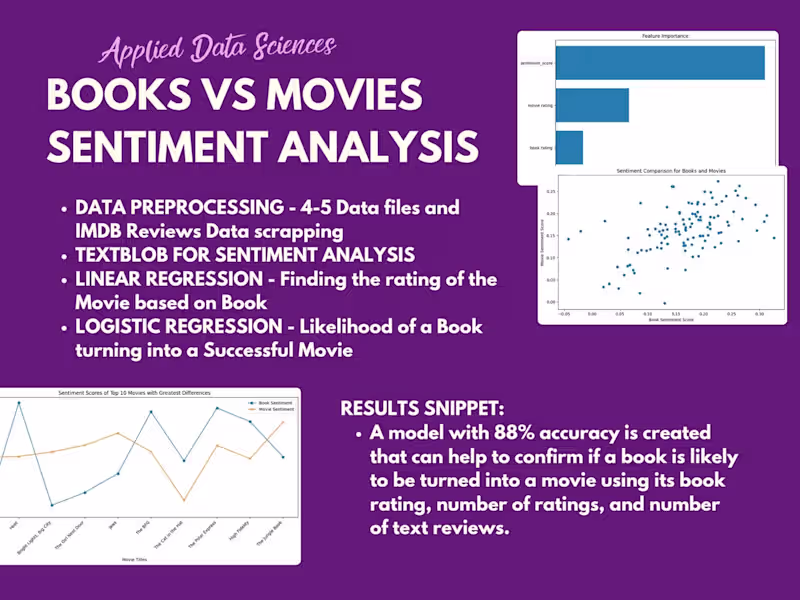

AI Developer Data Analyst and ML Expert
AI Developer Data Analyst and ML Expert
Precision-Driven Data Analyst & Assistant
Precision-Driven Data Analyst & Assistant
Game Design Consultant - GDD Expert
Game Design Consultant - GDD Expert


View more →
Data Scientist | Data Analyst | ML Engineer
Data Scientist | Data Analyst | ML Engineer

Data Scientist: Expert in Analysis, Databases, AI🔍
Data Scientist: Expert in Analysis, Databases, AI🔍