E-commerce Revenue Decline Analysis | Power BI & SQL Dashboard
Umair Nawaz
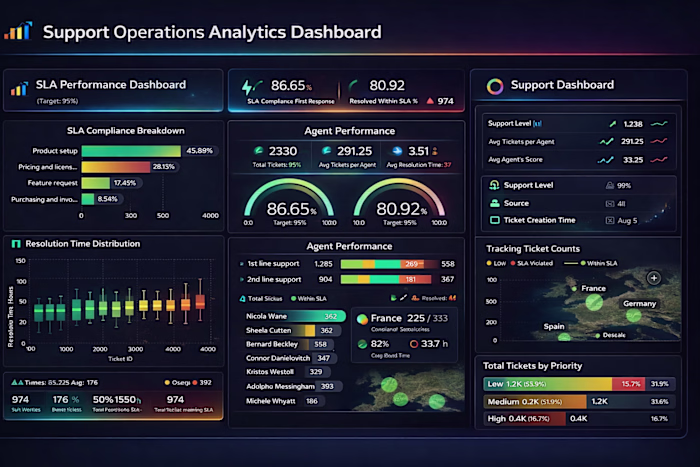
Interactive dashboard highlighting revenue decline drivers and business performance trends.
E-commerce Revenue Decline Analysis | Power BI Dashboard & Business Insights
An e-commerce business faced a 19% drop in revenue despite stable pricing and customer spending.
I analyzed sales trends, customer behavior, and operational performance to identify the root cause and built a Power BI dashboard to support data-driven decisions.
PROBLEM
The business faced a consistent drop in revenue after a period of growth.
While pricing and customer spending remained stable, overall performance declined year-over-year.
The key challenge was to identify:
Why sales were declining
Whether the issue was demand, pricing, or operations
What actions could reverse the trend
DATA & APPROACH
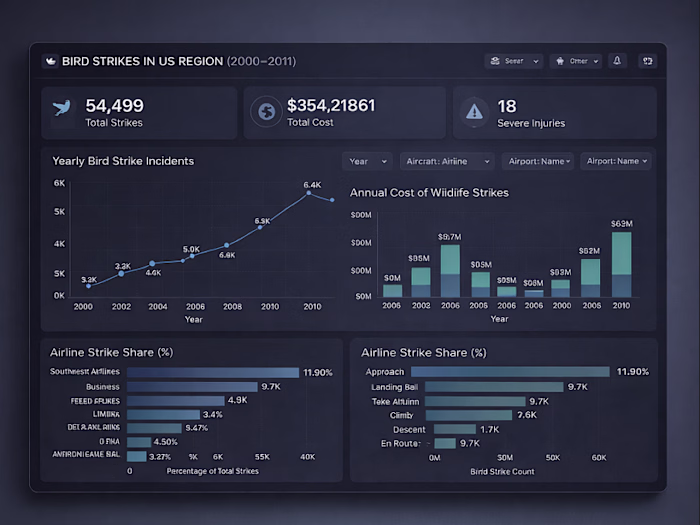
Analyzed multi-year e-commerce data (2020–2024)
Processed and cleaned data using SQL
Built an interactive Power BI dashboard to track KPIs and trends
Key metrics analyzed:
Revenue & order volume
Customer acquisition vs retention
Product category performance
Delivery speed & return rates
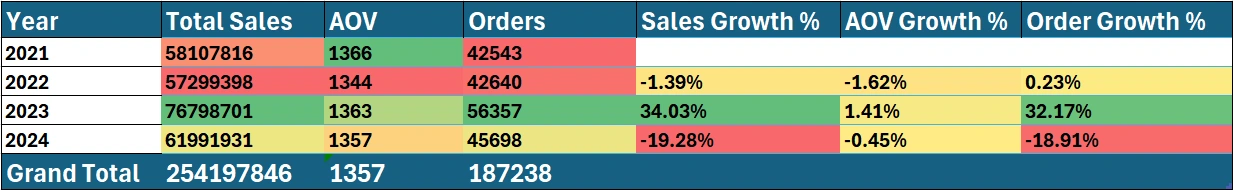
Revenue decline is primarily driven by reduced order volume rather than pricing changes.
WHAT I BUILT
Developed a business intelligence dashboard to help stakeholders monitor performance and identify growth opportunities:
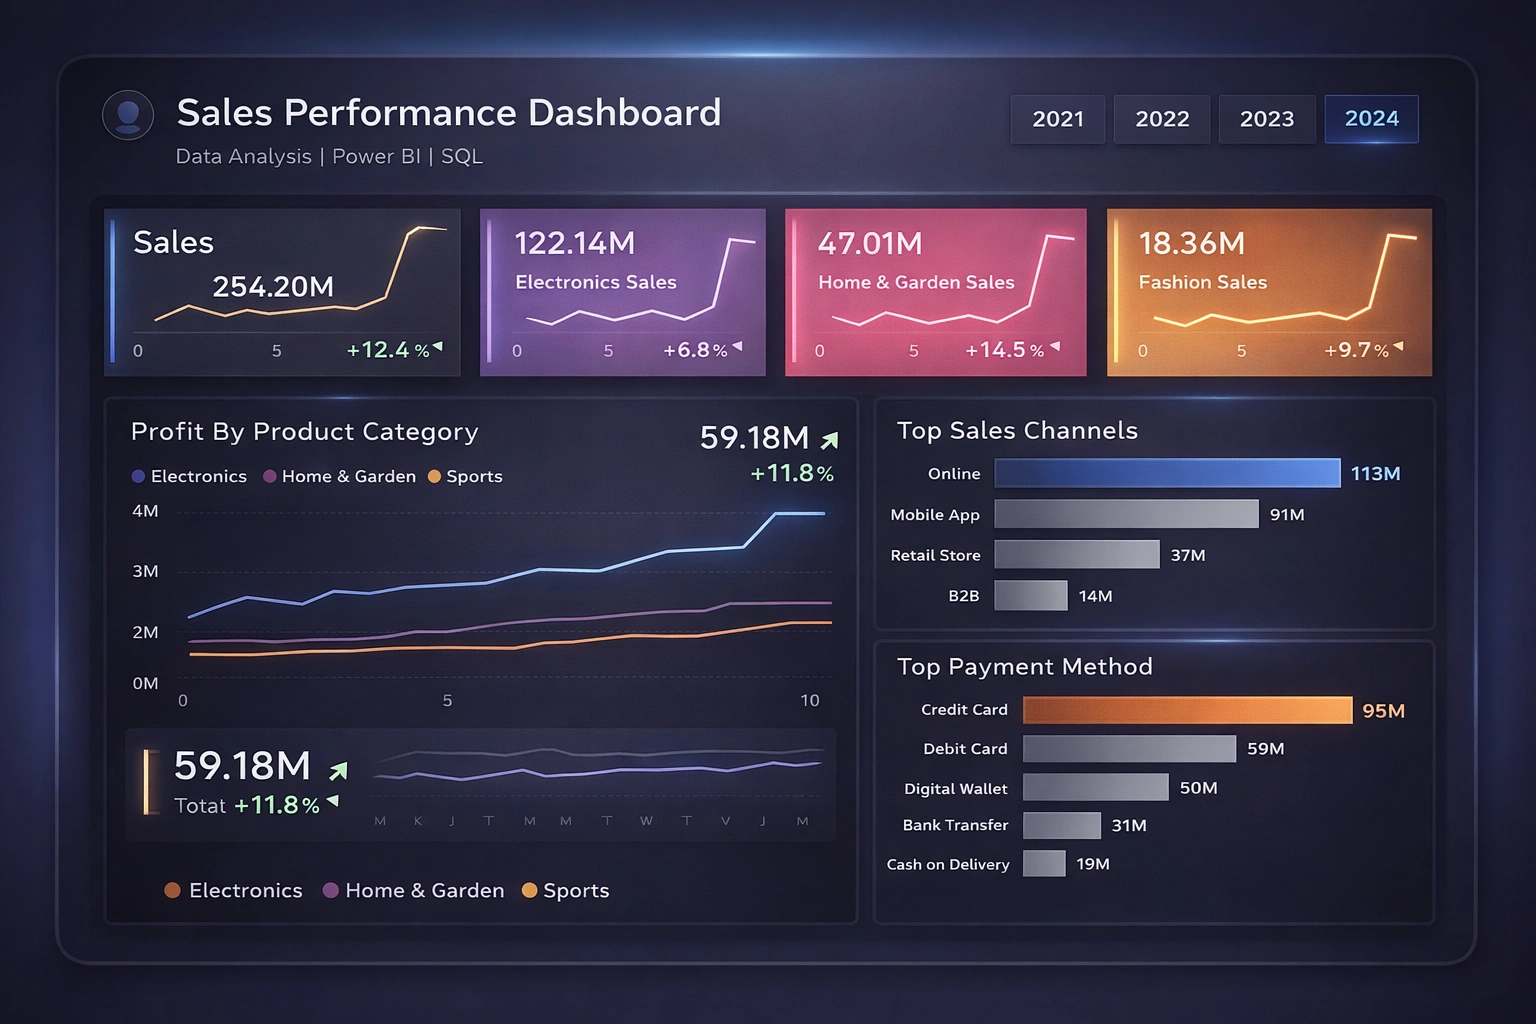
KPI tracking (Revenue, Orders, AOV)
Sales trends over time
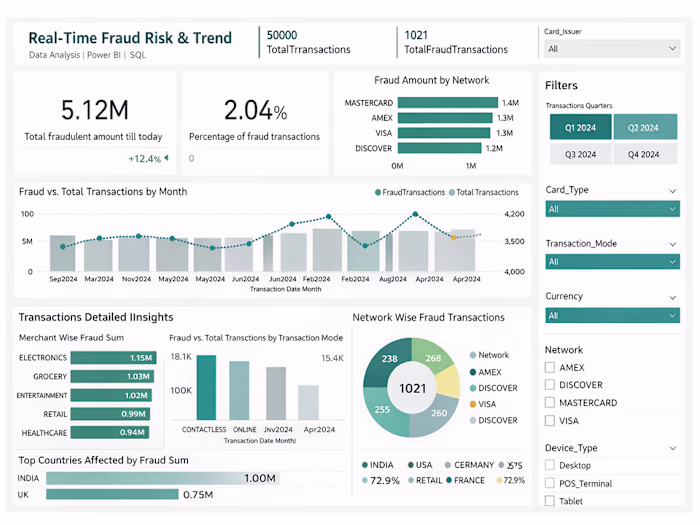
Customer behavior analysis
Product category performance
Operational insights (returns & delivery impact)
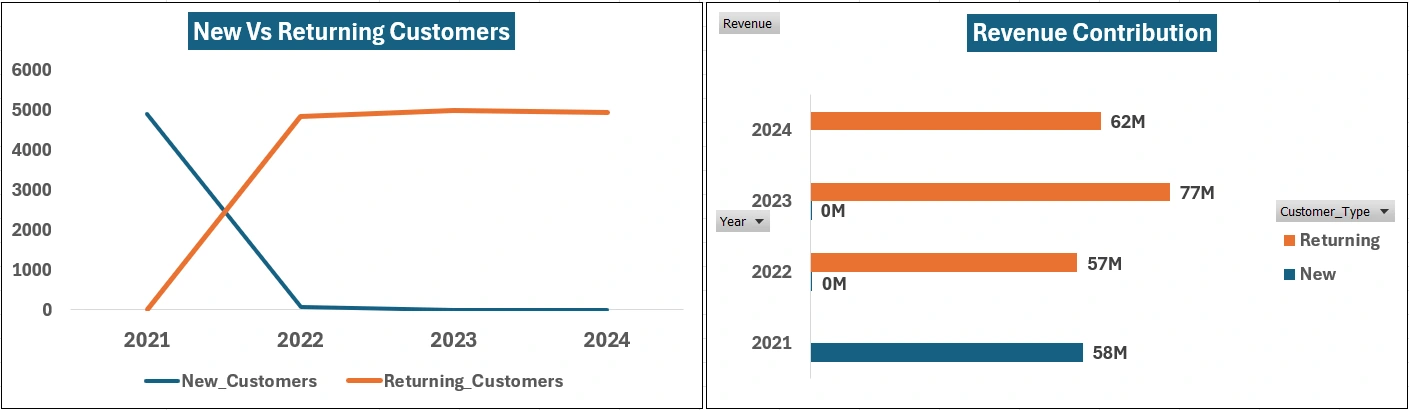
Customer acquisition slowed significantly, increasing reliance on returning users.
KEY INSIGHTS
Revenue dropped 19% YoY, driven by declining order volume (not pricing)
Customer acquisition slowed significantly after initial growth
Revenue became concentrated in a few product categories (high risk)
Slower delivery increased return rates by 3x, impacting margins
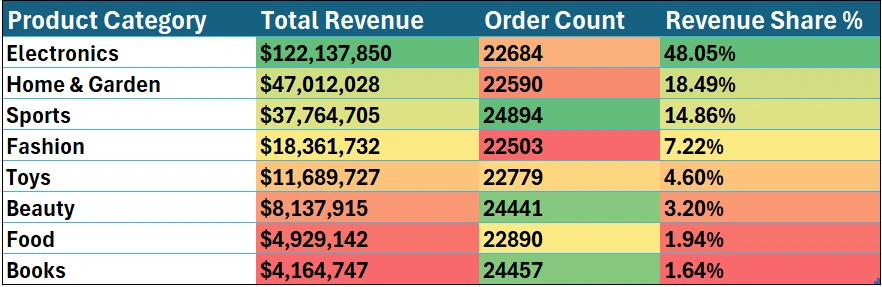
Revenue is heavily concentrated in a few product categories, increasing business risk.
BUSINESS IMPACT
This analysis identified a 19% revenue decline driven by a significant drop in order volume, highlighting demand and customer engagement challenges rather than pricing issues.
The insights enable businesses to:
Improve customer acquisition and retention strategies
Increase order frequency and engagement
Optimize operations to reduce return-related losses
Make data-driven decisions to restore sustainable growth
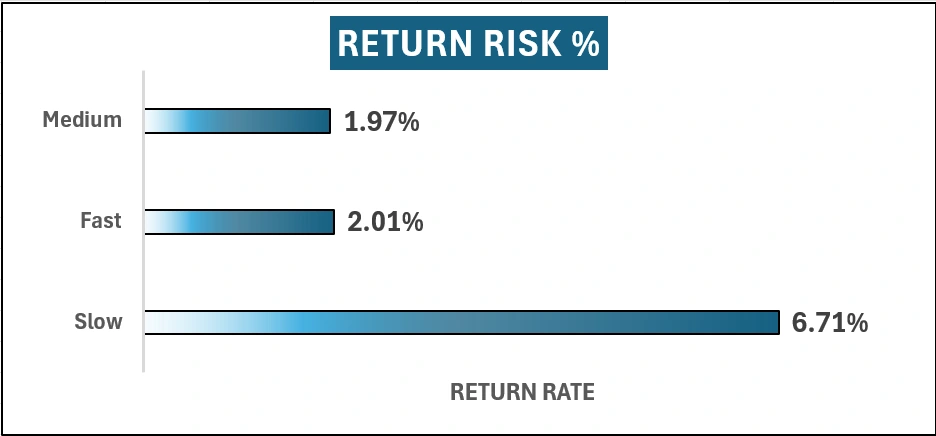
Slower delivery speeds are linked to higher return rates, impacting margins and retention.
RECOMMENDATIONS
Target high-value customer acquisition channels
Improve retention through personalized engagement
Expand product categories to reduce risk
Optimize delivery performance to reduce returns
WHO THIS IS FOR
This solution is ideal for:
E-commerce businesses
Sales managers
Business analysts
Decision-makers tracking revenue performance
TOOLS USED
SQL | Power BI | Excel
Project Resources
Looking to turn your data into actionable insights? Let’s work together.
Like this project
Posted Apr 6, 2026
Identified a 19% revenue decline using SQL & Power BI by analyzing sales, customer behavior, and operations to deliver actionable business insights.