Customer Support Performance & SLA Analytics System
Umair Nawaz
Customer Support Performance & SLA Analytics System
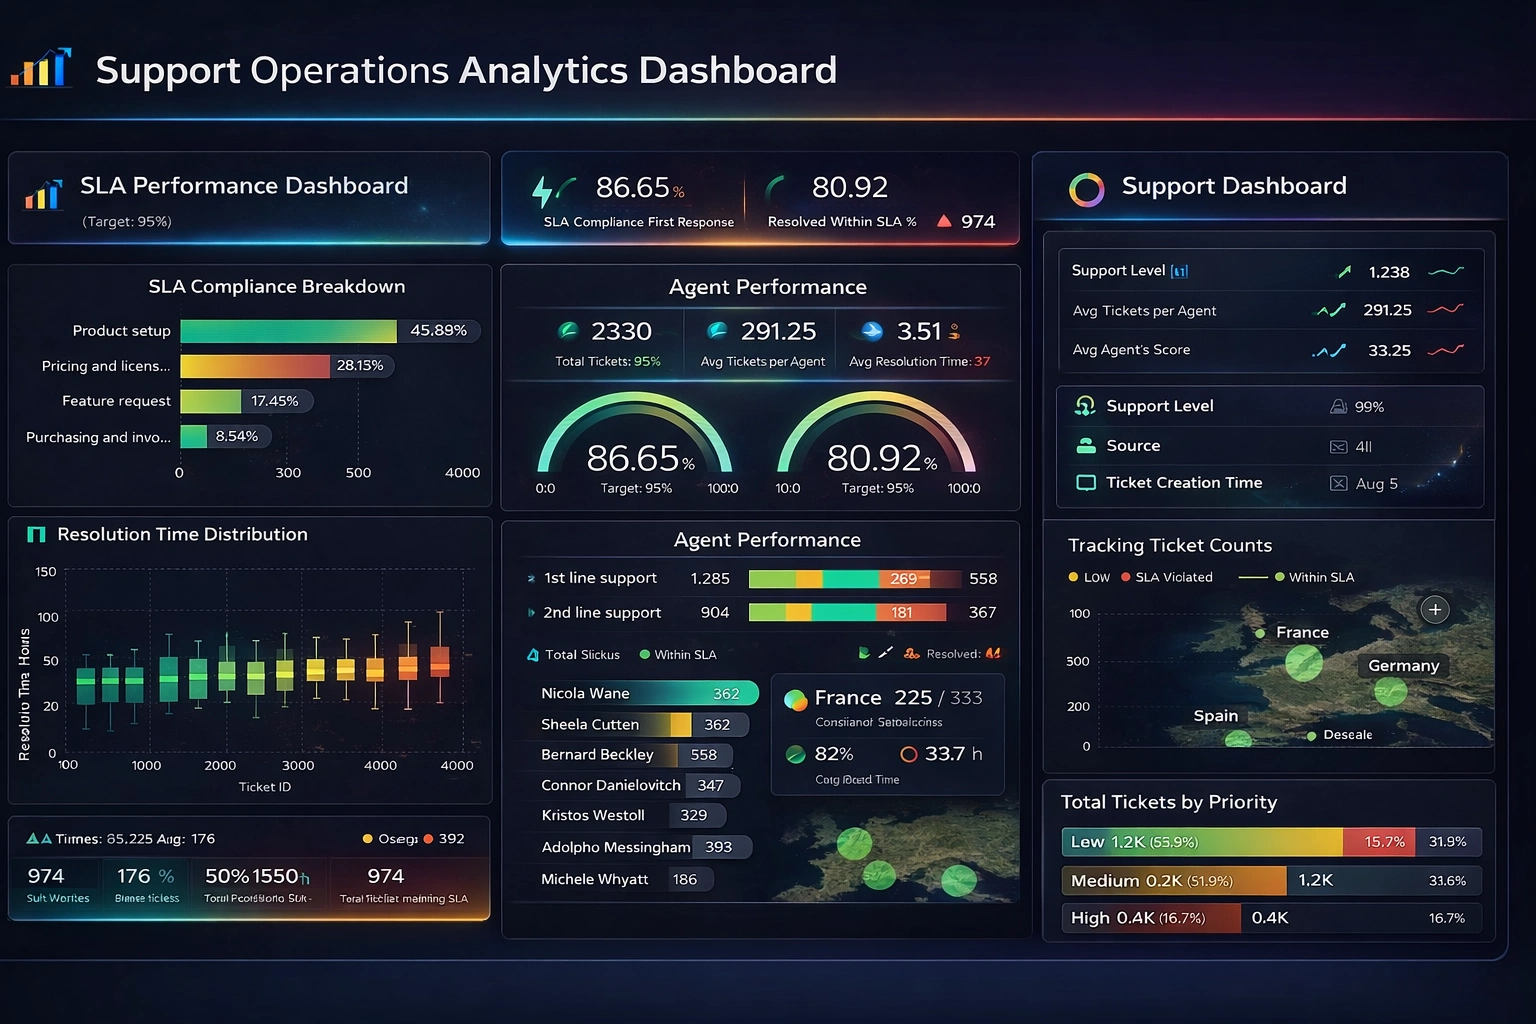
Support Operations Dashboard
Problem
A fintech client lacked visibility into customer support operations.
There was no structured reporting system to track:
SLA compliance
Ticket resolution performance
Agent productivity
This resulted in SLA breaches, unresolved tickets, and inefficient workload distribution, directly impacting customer satisfaction.
Solution
Built a data-driven support analytics system using Power BI, enabling real-time monitoring of support operations.
The solution focused on:
Centralizing ticket data into a unified dashboard
Tracking SLA compliance and breach rates
Monitoring ticket lifecycle (open, in-progress, resolved)
Analyzing agent performance and workload distribution
This transformed manual tracking into an automated, insight-driven system.
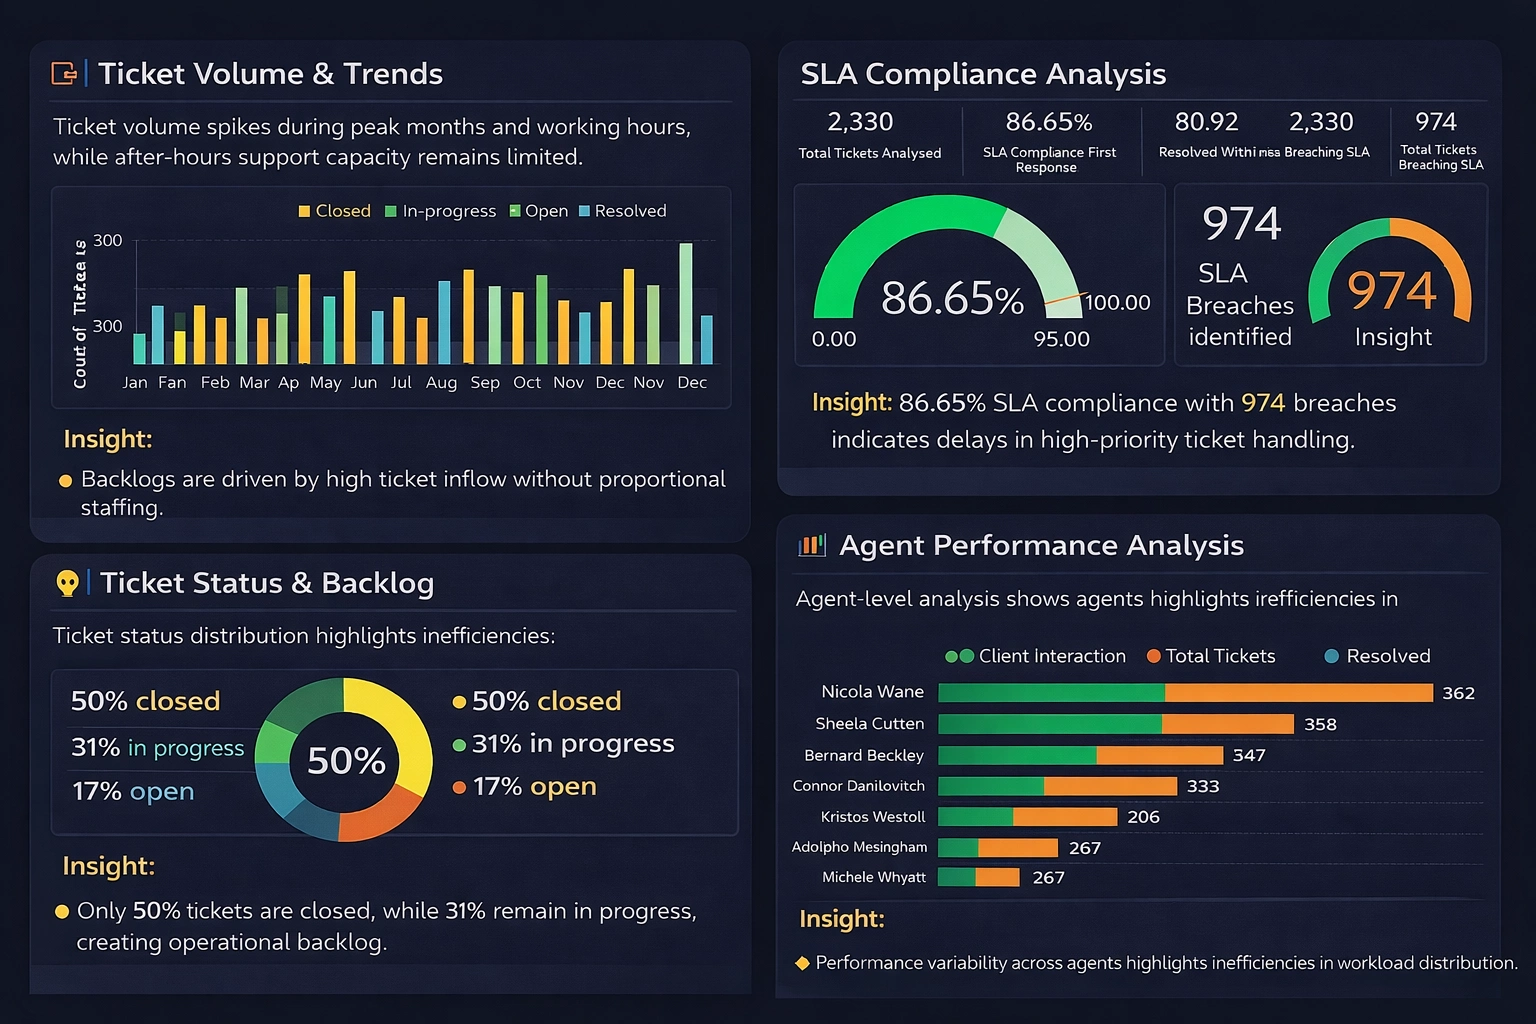
Key Insights
2,330 tickets analyzed across support operations
Only 50% tickets fully resolved, indicating backlog issues
974 SLA breaches identified, highlighting delays
86.65% SLA compliance, below optimal performance levels
These findings revealed critical inefficiencies in response time, prioritization, and resolution flow.
Impact
Improved visibility into support performance and SLA tracking
Enabled faster identification of bottlenecks and delays
Supported better resource allocation and workload balancing
Helped optimize response times and improve service quality
SLA dashboards are critical because they centralize performance metrics and enable proactive decision-making, improving efficiency and customer satisfaction
Approach
Data collection from support systems
Data cleaning and structuring
KPI development (SLA, tickets, performance)
Interactive dashboard design in Power BI
🛠 Tools
Power BI
Excel
Dashboard Highlights
Operational KPIS Overview
Outcome
Delivered a scalable analytics solution that enables continuous monitoring of support operations, reduces SLA risks, and improves overall customer experience.
Project Resources
- GitHub Repository:
https://github.com/mumairnawaz/support-operations-analytics-system
Like this project
Posted Apr 6, 2026
Developed a Power BI system for real-time support analytics for a fintech client.