
✈️ Aviation Risk & Safety Analytics System | Bird Strike Analysis
Aviation analytics dashboard providing a centralized view of bird strike incidents to support safety and operational risk analysis.
The project focuses on identifying high-risk flight phases, geographic hotspots, and airline-level exposure by analyzing over 54,000+ incident records.
Key KPIs highlight total incidents, financial impact, and injury severity, enabling clear visibility into risk patterns across aviation operations.
The analysis reveals critical patterns such as higher incident concentration during specific flight phases and regions, helping stakeholders better understand and manage safety risks.
Key Results
Analyzed 54K+ bird strike incidents across multiple years
Identified approach phase as highest risk (~22K incidents)
Highlighted high-risk states, airports, and airline exposure
Evaluated financial impact exceeding 35M+
Revealed time-based patterns (daytime highest exposure)
Key Results
Analyzed 54K+ bird strike incidents across multiple years
Identified approach phase as highest risk (~22K incidents)
Highlighted high-risk states, airports, and airline exposure
Evaluated financial impact exceeding 35M+
Revealed time-based patterns (daytime highest exposure)
Business Value
Improves visibility into aviation safety risks
Enables identification of high-risk flight phases and locations
Supports proactive safety planning and risk mitigation
Helps reduce operational disruptions and potential financial impact
Dashboard Insights
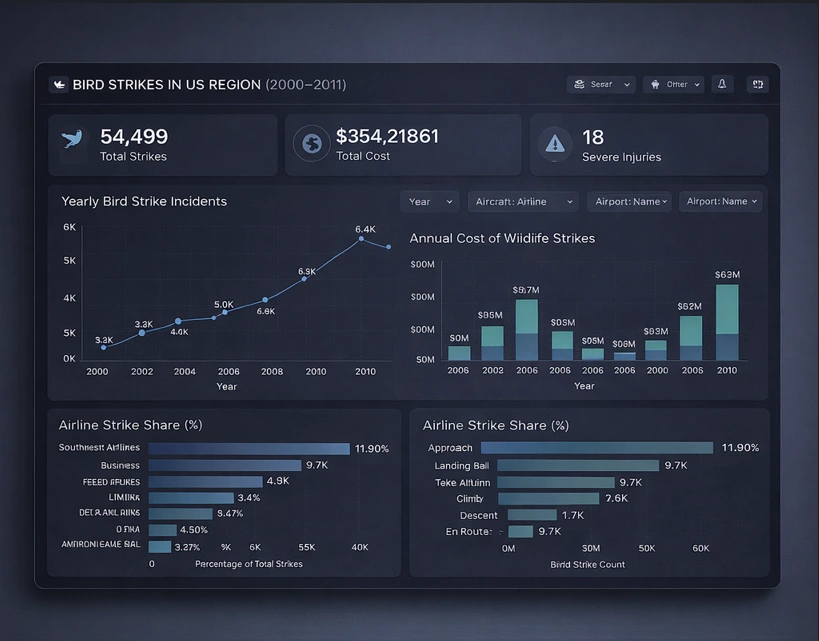
Aviation risk overview showing incidents, financial impact, and airline distribution.
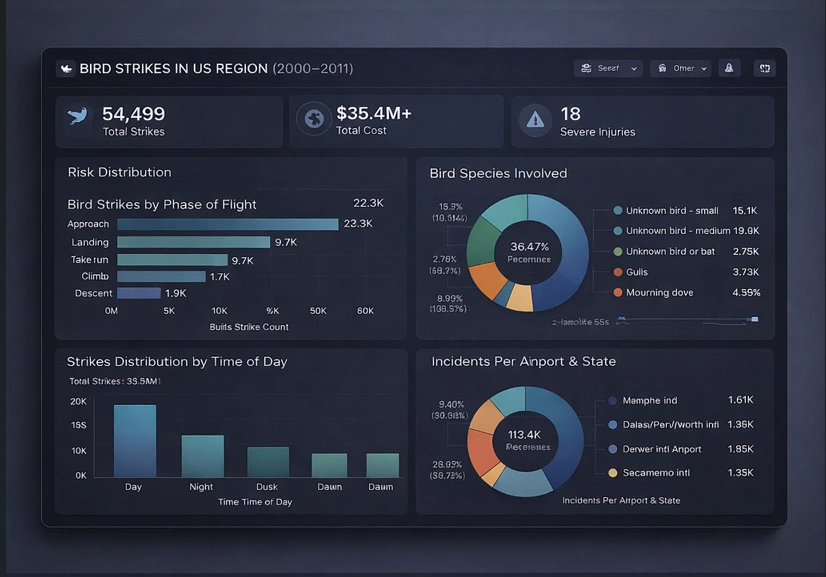
Risk analysis highlighting flight phases, time of day, and species patterns
🛠️ Tools
Power BI | Data Analysis | Data Visualization | Risk Analytics
Project Resources
0 likes · 6 views · Apr 4, 2026
Aviation analytics dashboard revealing high-risk flight phases, locations, and safety risks across 54K+ bird strike incidents.

