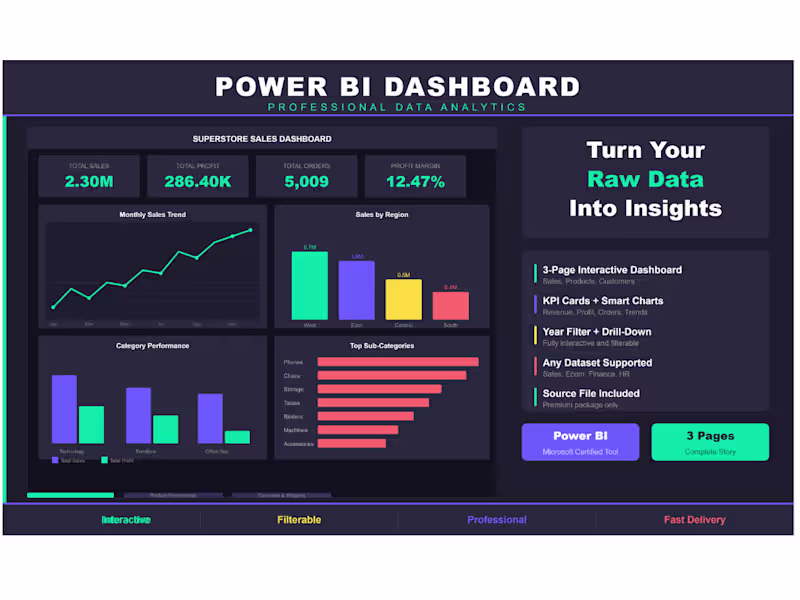
Projects using Microsoft Excel in IndiaProjects using Microsoft Excel in IndiaSuperstore Sales Dashboard — 3-Page Power BI Report
Built an interactive 3-page Power BI dashboard using
the Superstore Sales dataset (9,994 orders across USA).
Page 1 — Sales Overview: KPI cards, monthly trend,
regional breakdown, category performance.
Page 2 — Product Performance: Top products, category
donut, profit analysis, sales vs profit scatter.
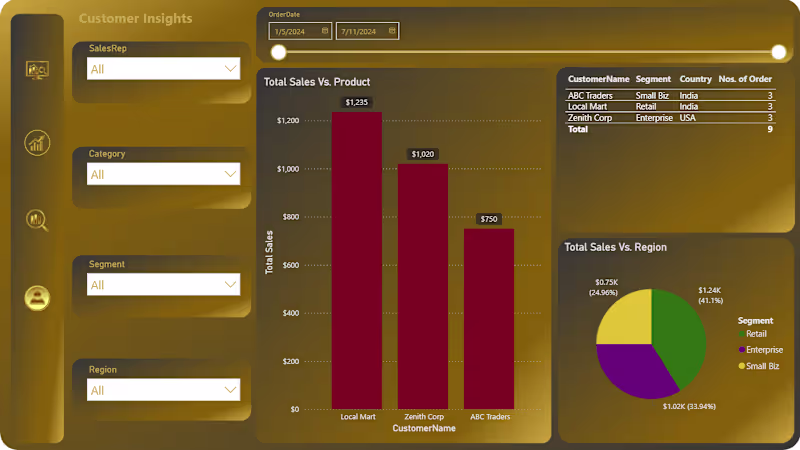
Page 3 — Customer & Shipping: Segment breakdown,
top 10 customers, monthly growth, ship mode distribution.
Tools: Power BI, DAX, Superstore Dataset
Theme: Dark professional with interactive year filter.