
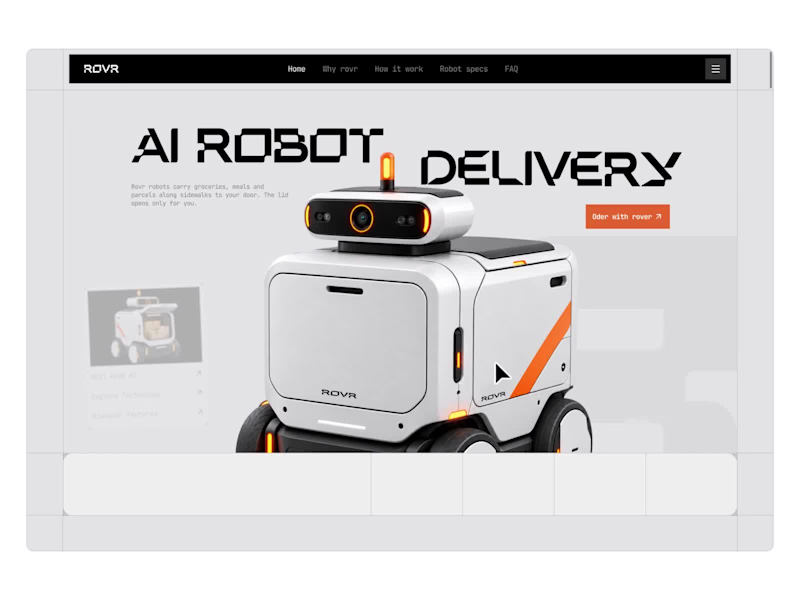
From sidewalk to doorstep.
A closer look at ROVR, a landing page concept for an autonomous delivery robot.
A robot at your door is new for most people, so every section answers a question a first time customer would ask: how it gets here, what it can carry, what it costs and what happens if it gets stuck.
Our favorite part is the FAQ, rebuilt as a chat where you can ask ROVR anything.
What would you want to know before a robot delivers your groceries?
3
2
734
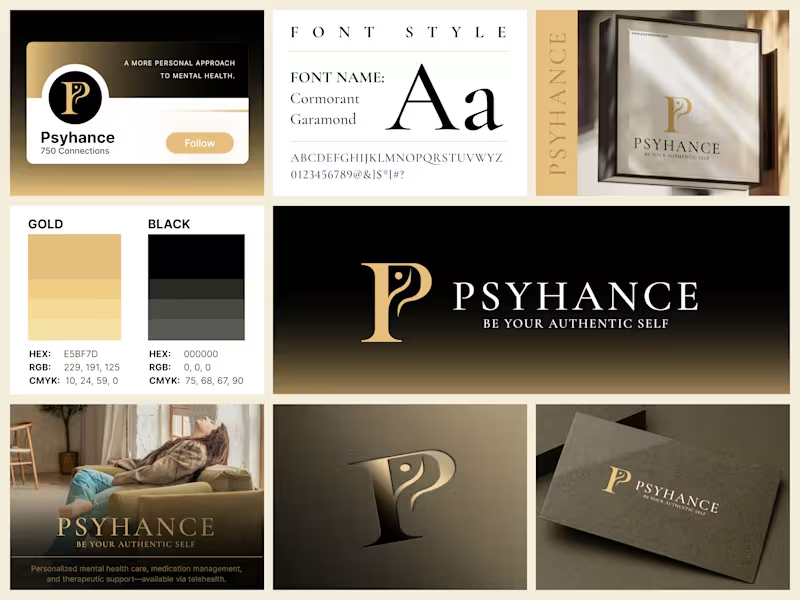


Welcome to the studio!
Every project tells a different story, and I wanted a place where they could all live together.
I've recently refreshed the Shrutillusion Studio website to better reflect the practice I'm building - bringing together selected work across brand identity, editorial design, and illustration, along with my design approach, services, and process.
If you're curious about my work, I'd love for you to take a look.
🌐 www.shrutillusion.com (http://www.shrutillusion.com)
0
631


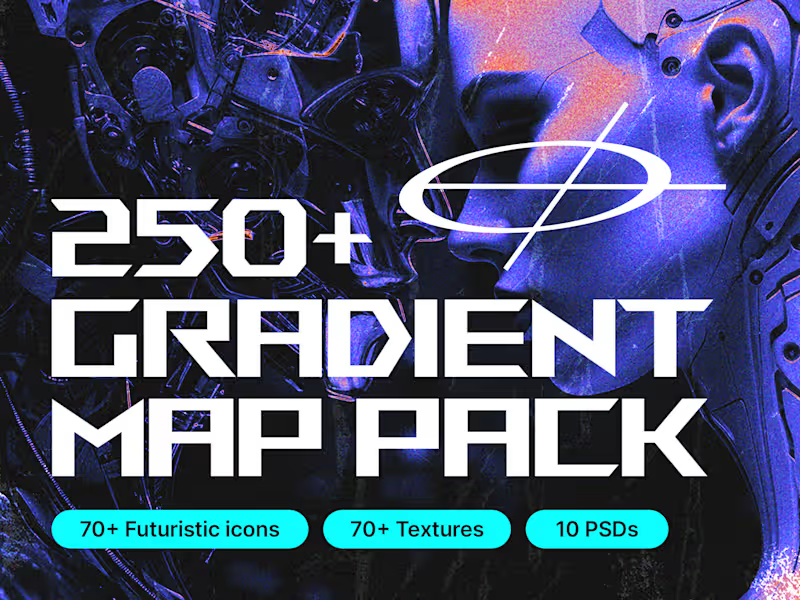
It's been 6 years in building this product, It has the best gradients, Futuristic icons, textures and brushes.
I've used this everyday in my designs wherever needed, I thought it's time to give back to the community of my own people so here it is.
It is totally free to use it.
Try it and let me know in the reviews.
If you have any questions on it, my DMs are always open.
Thank you guys for always inspiring 🙌
0
224


Milestone timeline wall I designed. 17 years of growth. 10+ acquisitions across 4 countries. All of that information had to fit on a single wall in their head office corridor, and still be readable from 10 feet away.
The tricky part with timeline designs like this is managing density.
You have 15+ logos, country flags, acquisition labels, and year markers. If you just list them linearly it becomes a spreadsheet on a wall. Nobody reads that.
So I built it around a mountain progression. Each peak represents a growth phase. The timeline flows bottom-to-top instead of left-to-right, which naturally maps to the "climbing higher" narrative. The clouds separate the visual layers so the density doesn't overwhelm.
Designed for large-format print. This sits in their main office corridor.
2
195


Designed a smarter way to understand complex energy networks.
A UX/UI and product design exploration for Adani Electricity, bringing network mapping, infrastructure data, alerts and analytics into a clearer experience across mobile and web.
A project focused on enterprise UX, data visualization and scalable product thinking.
Open to product design collaborations and long-term design partnerships.
2
4
303