Product Data Analytics Projects in India
Product Data Analytics Projects in India
Sign Up
Post a job
Sign Up
Log In
Filters
2
Projects
People
Message
2
Denish Kukadiya
pro
Google Analytics Enhance Data Collection and Reporting
2
22
Message
0
Sparsh Gupta
pro
Merchant Activity Dashboard
0
12
Message
8
Geethasree Naguboina
pro
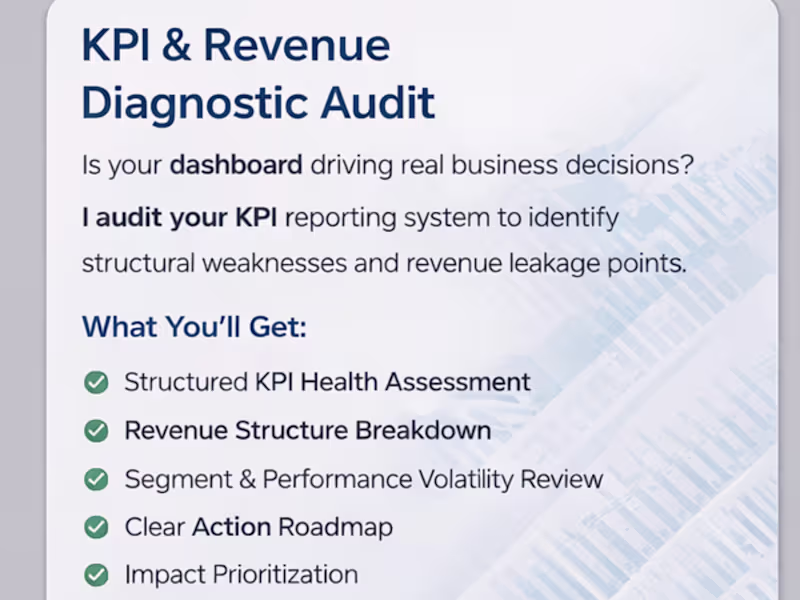
Most dashboards don’t have a visualization problem. They have a KPI problem. I’ve reviewed dozens of reporting systems recently and the pattern is consistent: Metrics are defined differently across sheets “Revenue” means one thing in finance and another in marketing KPIs are tracked… but not tied to decisions Dashboards look clean but don’t answer operational questions When metric logic isn’t aligned, teams don’t have a data problem. They have a decision problem. That’s why I’ve started offering a structured KPI & Revenue Diagnostic Audit — focused on: • Metric consistency • Reporting logic • Revenue driver alignment • Decision-readiness If you're building dashboards or scaling reporting systems, this layer matters more than design.
8
8
315
Message
0
Paresh Pavani
YoGi Website Team offering Free demo
0
123
Message
0
Rishabh Gupta
pro
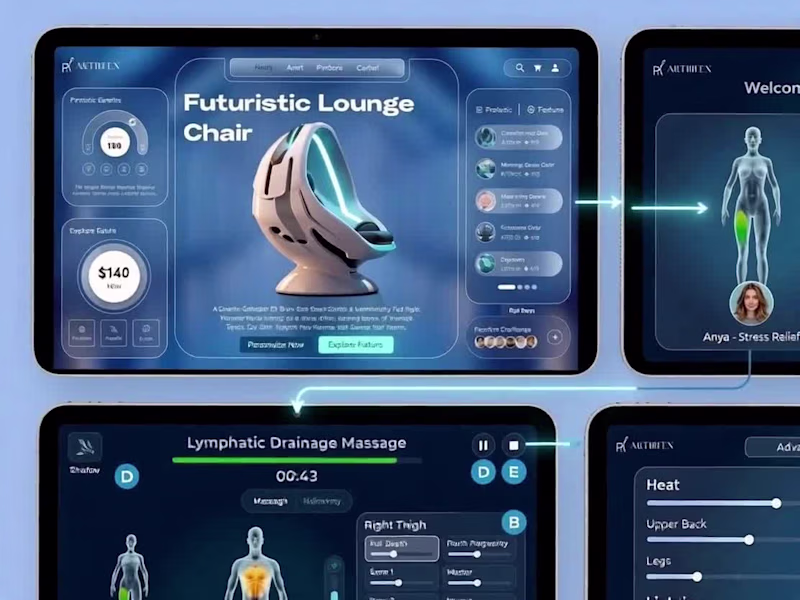
This project represents a fusion of high-end industrial design and user-centric digital interfaces. The goal was to transform the experience of a "Futuristic Lounge Chair" from a simple utility into an immersive wellness ecosystem. Below is the structured content and design approach used for this project. 1. Project Vision To create a seamless, cohesive digital experience that bridges the gap between luxury furniture and advanced medical-grade massage technology. The interface is designed to feel as "premium" as the chair itself, utilizing a "Glassmorphism" aesthetic that matches the futuristic pod-like hardware. 2. Design Approach: The "Glass-Wellness" Framework A. Visual Language (UI) Color Palette: Deep midnight blues and cyans provide a calming, "spa-at-night" atmosphere. High-contrast accent colors (lime green for active zones, amber for heat) provide clear functional feedback. Aesthetics: * Frosted Glass (Glassmorphism): Used for panels to create depth and a lightweight feel. 3D Anatomical Mapping: A high-fidelity human model provides immediate visual feedback on where the massage is currently focusing. Typography: Clean, sans-serif fonts (like Montserrat or Inter) for maximum legibility on tablet screens. B. User Experience (UX) & Interaction Zero-Gravity Navigation: Large, thumb-friendly hit targets were prioritized, recognizing that users are often reclined and less precise with their movements. Contextual Awareness: The interface changes based on the user’s state—moving from a "Discovery" mode (Product Benefits) to an "Active" mode (Live Session Management). 3. User Flow & Interaction Design Phase I: Discovery & Personalization Landing Interface: Displays the chair's technical specs (16H battery life, mental wellness benefits). Profile Selection: Users select or create a profile (e.g., "Anya - Stress Relief" or "Leo - Recovery"). This automatically adjusts the chair’s physical dimensions and pressure preferences. Phase II: Program Selection Dynamic Library: A scrollable list of specialized programs like "Lymphatic Drainage," "Deep Tissue," or "Yoga Stretch." Visual Preview: Selecting a program highlights the targeted body zones on the 3D model before the session starts. Phase III: Active Session Management Real-time Feedback (A): The 3D avatar pulses in the area being massaged (e.g., Anterior Right Thigh). Intensity Granularity (B): Side-panel sliders allow users to adjust "Roll Depth" and "Pinch Frequency" per zone without pausing the session. Status Indicators (D): Clear display of remaining time, current technique (Shiatsu), and a prominent "Emergency Stop/Pause" button (E). Phase IV: Advanced Environment Control Ambient Sync (F): A dedicated settings panel to control the "pod environment." Heat Mapping: Specific sliders for Upper Back and Leg heat. Chroma-Therapy: A color wheel to adjust the chair’s internal LED lighting. Audio Integration: Options for Nature Ambiance or custom Spotify playlists synced to the massage rhythm. 4. Technical Constraints & Solutions Hardware Limitation: To ensure the interface runs smoothly on standard chair tablets, heavy 3D renders are replaced with high-quality 2D sprite sheets or lightweight WebGL to maintain 60fps performance. Low-Light Optimization: The "Dark Mode" default prevents eye strain during evening use, which is when most users utilize massage chairs. Project Outcome The result is an interface that doesn't just "control" a chair, but manages an entire Wellness Environment, making the technology feel invisible and the relaxation feel absolute.
0
72
Message
10
Rohit kamble
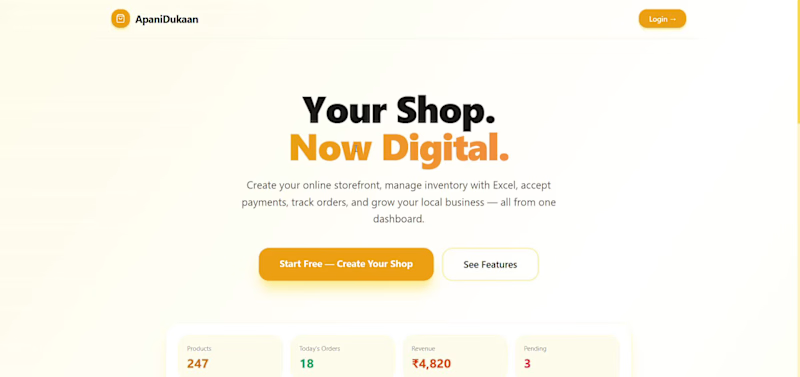
Retail tools today are either too complex… or too limited. So I built something better. 👉 https://www.apanidukaan.live/ Apni Dukaan is a smarter way to manage and understand your business — without the clutter, confusion, or unnecessary features. What it brings to the table: • Clean, powerful insights that actually make sense • Built for real-world usage, not just dashboards • Fast, intuitive, and easy to get started • Scales as your business grows It’s not about adding more features — it’s about building the right ones. 🎥 Demo video attached — would genuinely love your feedback. If you’re into startups, SaaS, or building useful products, let’s connect. #buildinpublic #startup #saas #indiebuilder
2
10
453
Message
6
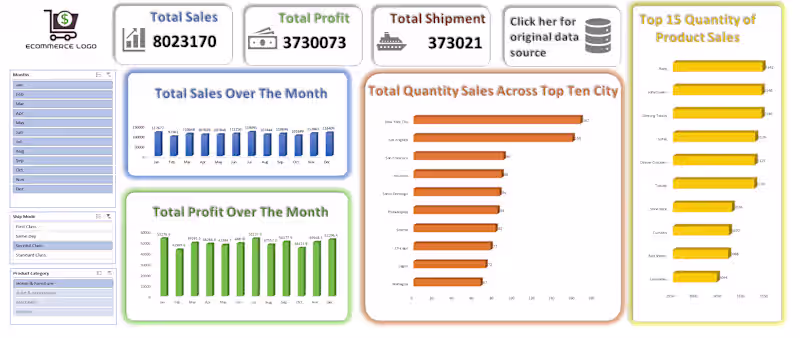
Alok Tripathi
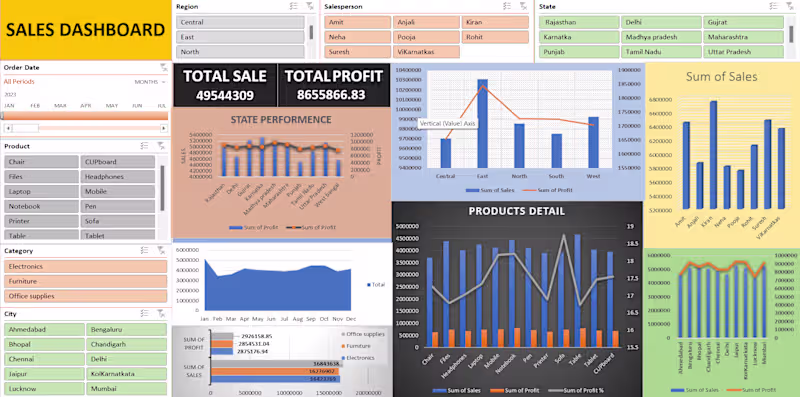
I will create professional Excel dashboards using your data to analyze sales, profit, performance, and trends. My dashboards are clean, easy to use, and designed for real business needs. What I offer: Excel dashboards with charts and visuals Pivot tables and data analysis Interactive slicers and filters Sales, profit, and performance tracking Clean and organized data layout Why choose me: Accurate and clear analysis Fast delivery Easy communication Revisions until satisfaction (as per package) Use cases: Sales & revenue analysis Business performance dashboards Product & region-wise reports Monthly or yearly reporting Please message me before placing an order to discuss your data and requirements.
4
6
97
Message
0
Tannu Antil
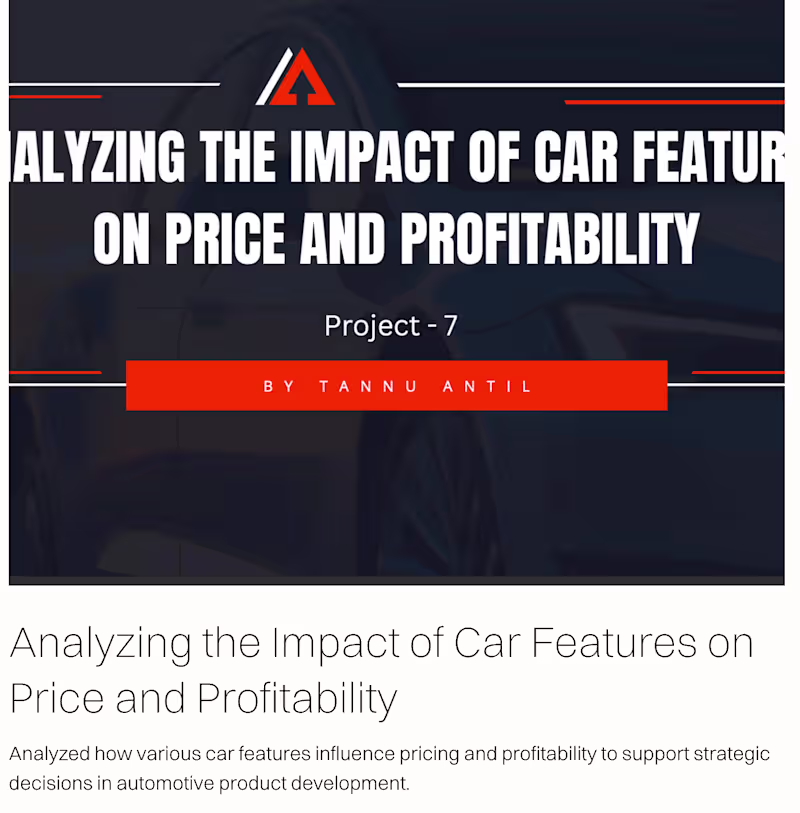
Analyzing the Impact of Car Features on Price and Profitability This project aimed to identify which car features most significantly affect pricing and profitability for manufacturers in a competitive and evolving market. The insights generated can guide pricing strategies and product development decisions to better align with consumer expectations and maximize returns.
0
70
Message
0
Mahin Sherashia
Certified Google Analytics Expert
0
9
Message
1
Subash S
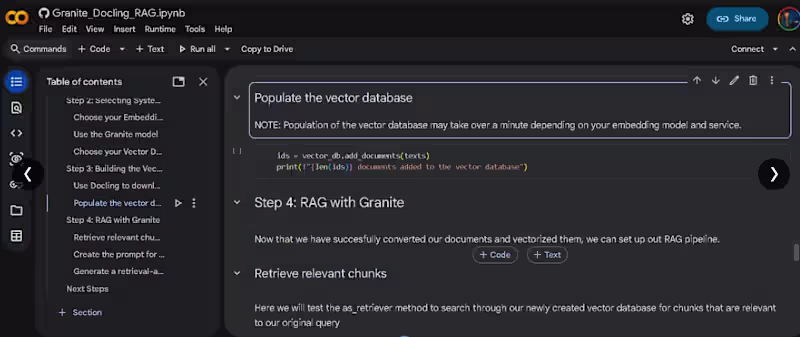
RAG is only as good as the data you feed it. 📄➡️🤖 I am excited to share that I’ve completed the Build an AI-Powered Document Retrieval System with IBM Granite and Docling lab from IBM SkillsBuild! While my previous work focused on the RAG pipeline, this lab went deeper into the most critical step: Document Parsing. We often forget that real-world data isn't clean text—it's locked in complex PDFs and formatted documents. What I built in this hands-on lab: 🔹 Advanced Parsing with Docling: I used Docling to not just "read" text, but to understand the structure of documents, preserving the context for the AI. 🔹 Granite Power: Leveraged IBM Granite models (granite-embedding-30m-english) to create high-quality vector embeddings. 🔹 Seamless Integration: Orchestrated the entire workflow using LangChain to connect the parsed data with the retrieval engine. This skill allows me to build AI agents that don't just "guess" answers but can accurately retrieve information from complex business documents. Technical breakdown of what I built: 🔹 Orchestration: Used LangChain to manage the flow between the user, the database, and the model. 🔹 Embeddings: Leveraged IBM Granite models (granite-embedding-30m-english) to convert text into vector representations. 🔹 Data Processing: Implemented document loading and chunking strategies to optimize context windows. 🔹 Synthesis: Created a system that retrieves relevant data and generates accurate, fact-based summaries. This experience has given me the practical skills to build AI applications that are not just "smart," but also accurate and domain-specific.
1
32
Message
0
Pritesh Parmar
EDA on sales dataset
0
29
Message
0
HRYBRAND web graphic services
I will create amazon product listing variation store setup
0
16
Message
0
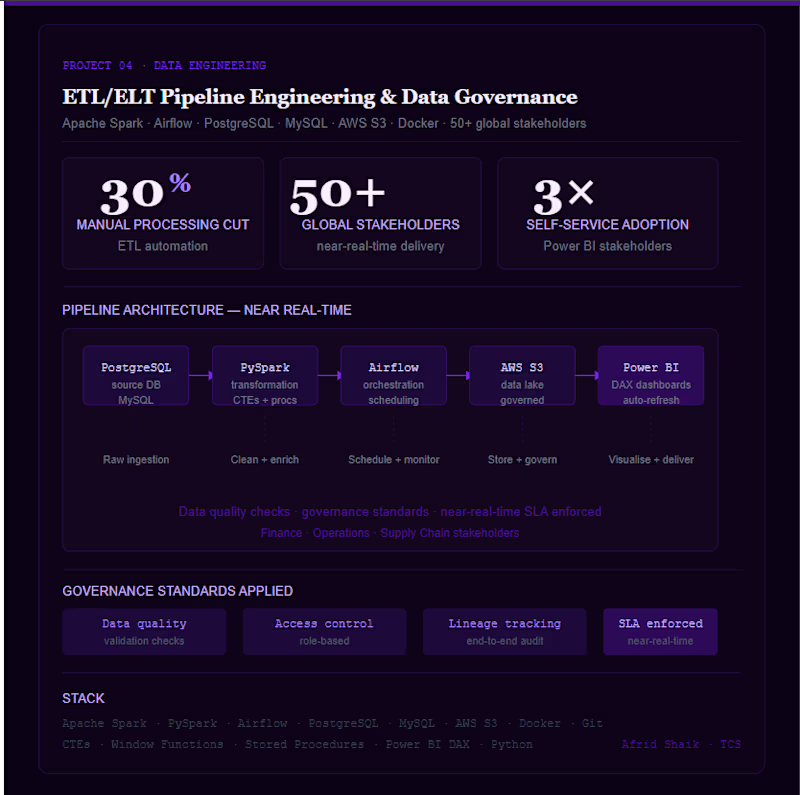
AFRID SHAIK
ETL/ELT ,50+ Global Stake holders
0
10
Message
0
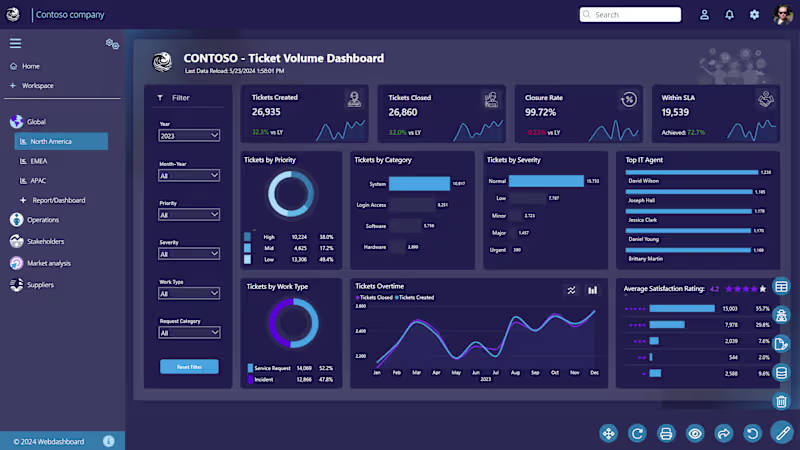
Urvi Walia
IT Service Management Dashboard Project Developed an interactive IT Service Management dashboard to monitor ticket volume, incident trends, SLA performance, and support team efficiency. Analyzed operational support data to identify service bottlenecks, improve response times, and support data-driven operational decisions. Key Business Insights & Decisions: Monitored ticket creation and closure trends to improve operational efficiency Identified high-priority and high-severity incidents requiring immediate attention Tracked SLA compliance rates to reduce delayed ticket resolutions Analyzed support categories and work types to optimize resource allocation Evaluated top-performing IT agents based on ticket resolution performance Improved service quality monitoring through customer satisfaction analysis Dashboard Highlights: Ticket Volume & Closure Tracking SLA Performance Monitoring Ticket Priority & Severity Analysis Support Category Breakdown IT Agent Performance Analysis Customer Satisfaction Metrics Interactive Filters for Dynamic Reporting Skills Used: Data Cleaning & Transformation Exploratory Data Analysis (EDA) KPI Monitoring & Reporting Operational Data Analysis Data Visualization Dashboard Development Business Intelligence Reporting Insight-Driven Decision Making Tools & Technologies: Power BI • Excel • SQL • Python • DAX • Data Visualization
0
13
Message
0
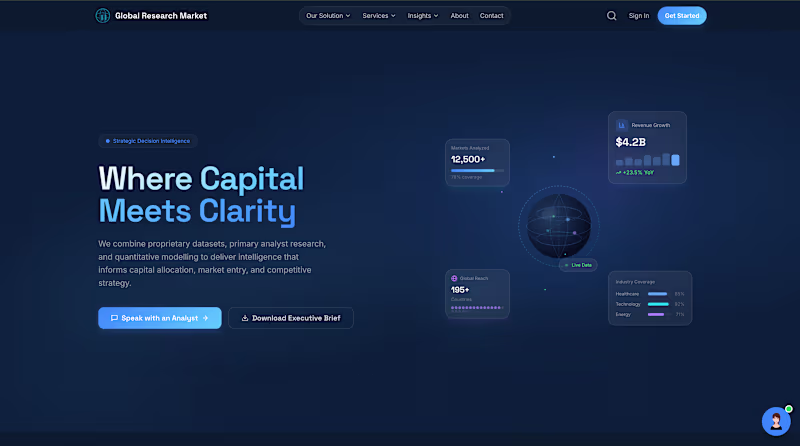
ajeet kumar
Global Research Market — Capital Intelligence SaaS Platform
0
49
Message
0
Pratyaksh Suri
EDA Projects
0
9
Explore projects