Designing Experiences That Click | Gold Medalist


View more →
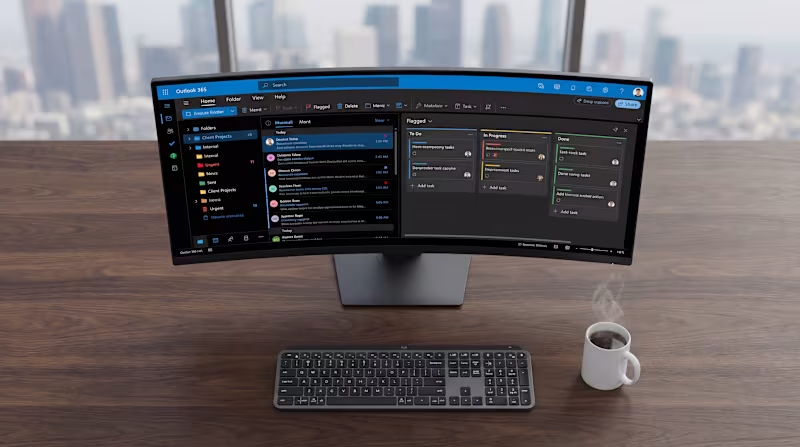
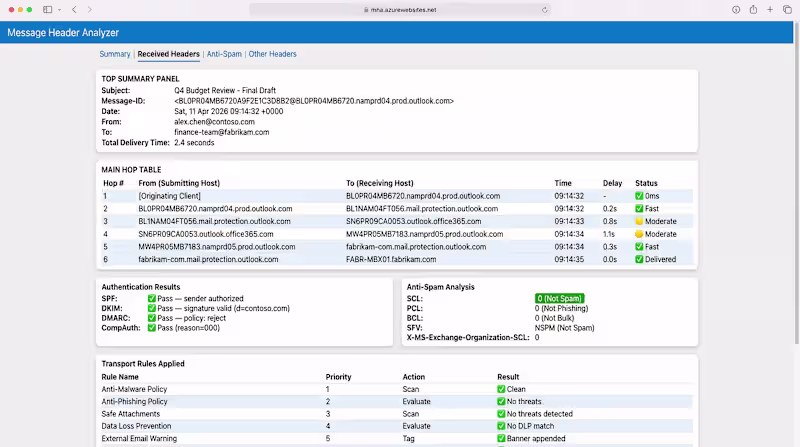
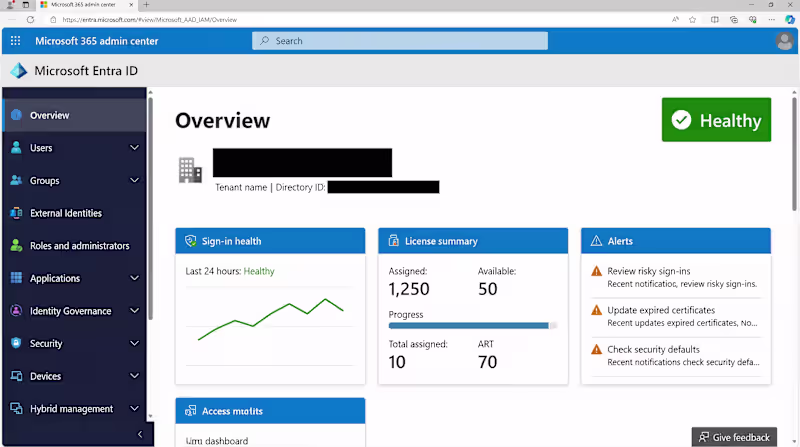
M365 Admin, Outlook expert, Security, Migration & Cloud Infr
New to Contra
M365 Admin, Outlook expert, Security, Migration & Cloud Infr

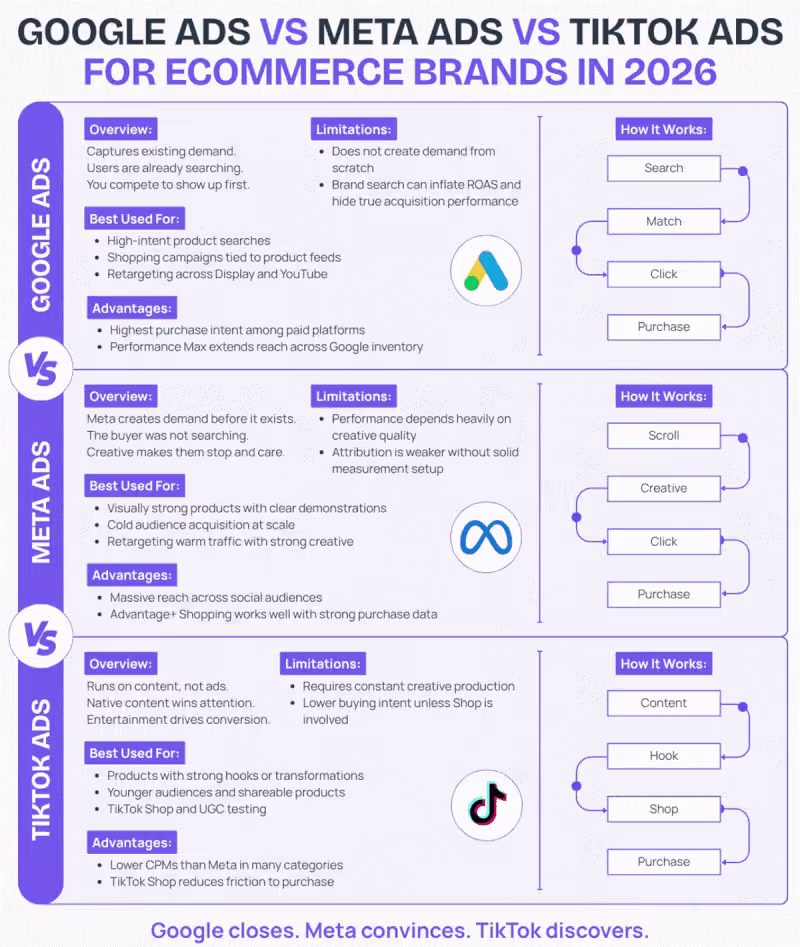
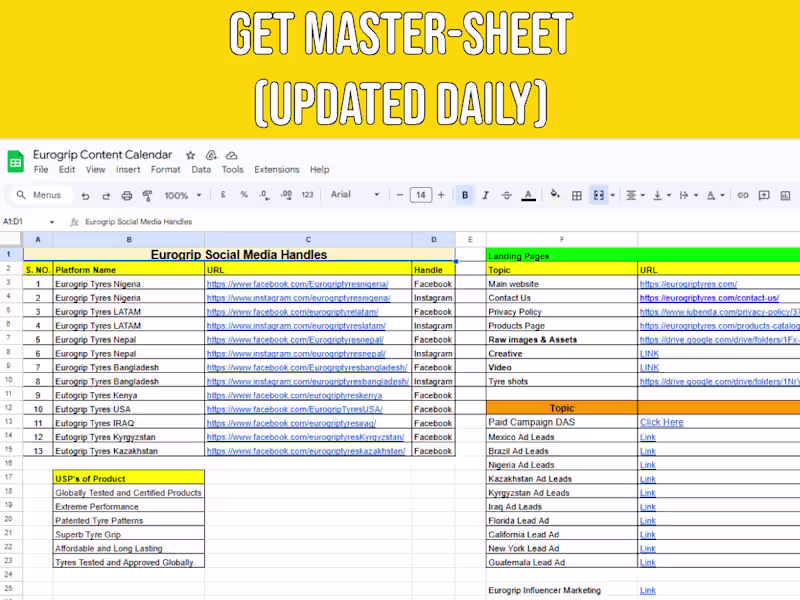
Google & Meta Ads for B2B SaaS | Lead Gen Specialist
Google & Meta Ads for B2B SaaS | Lead Gen Specialist

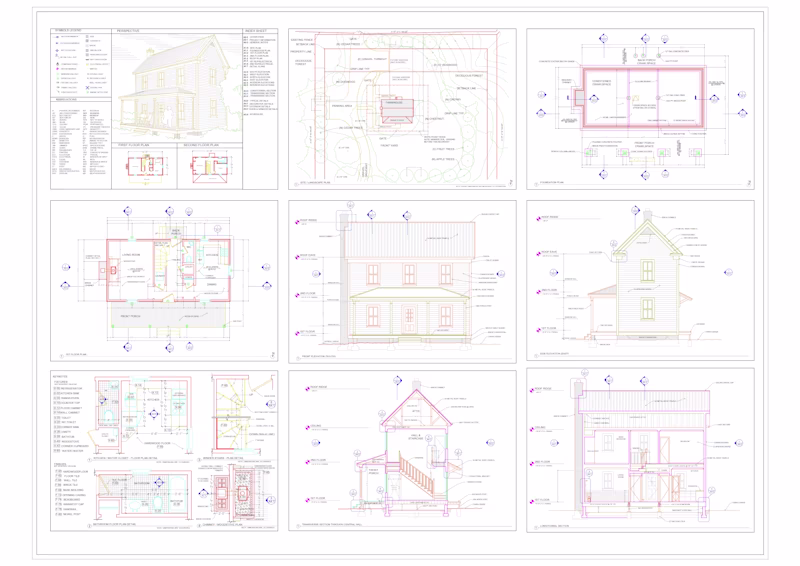
Architect, creating high quality 3d rendering and drafting
Architect, creating high quality 3d rendering and drafting


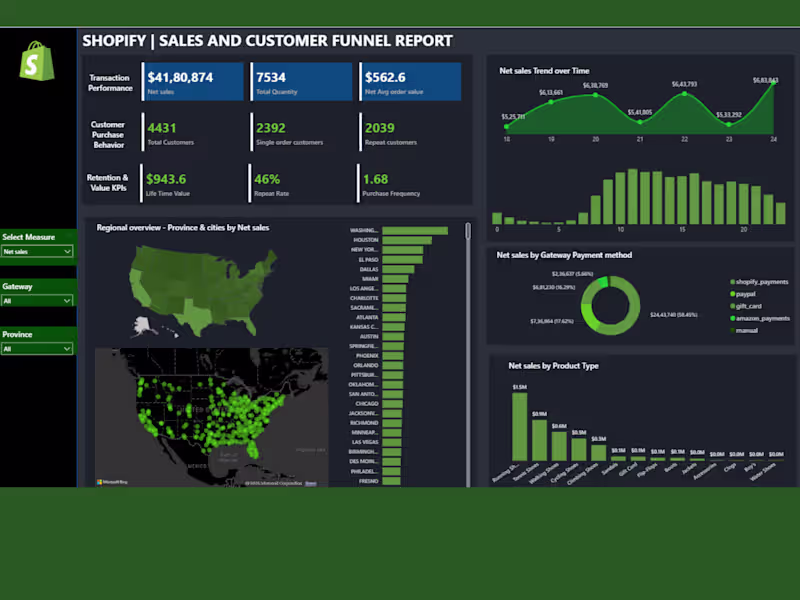
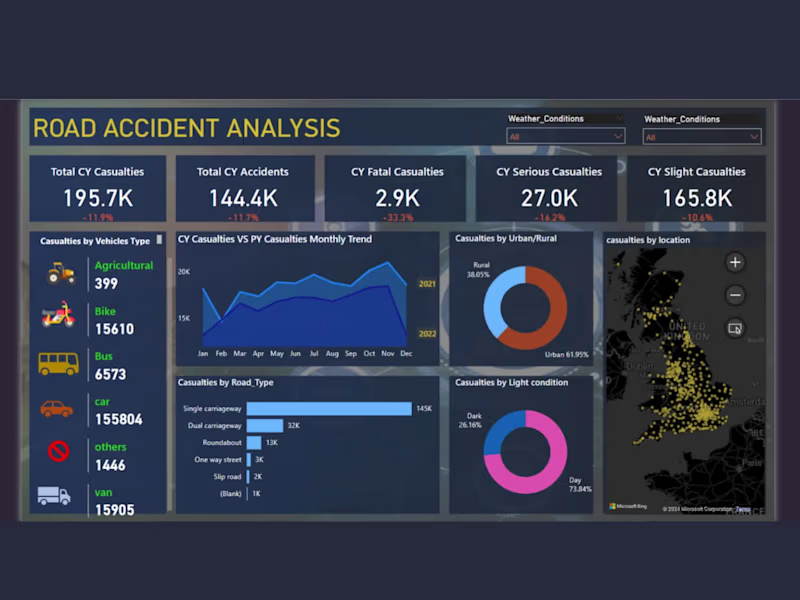
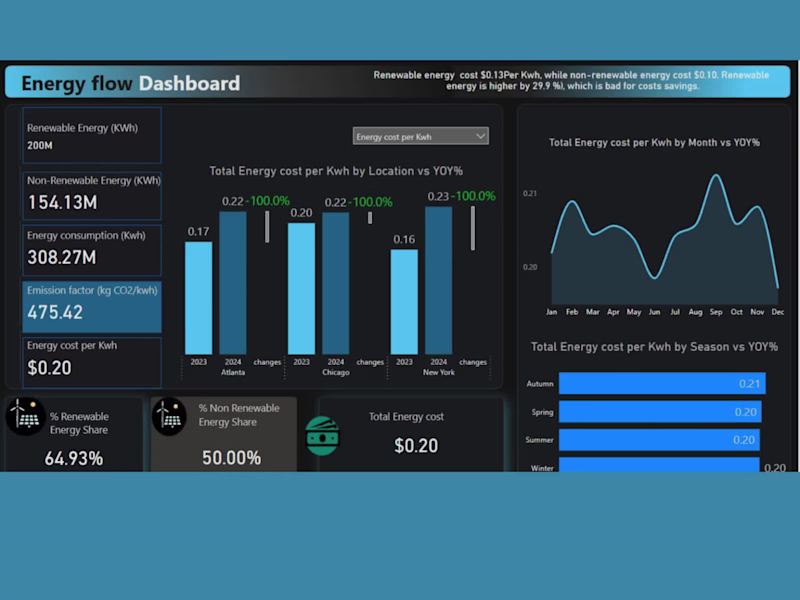
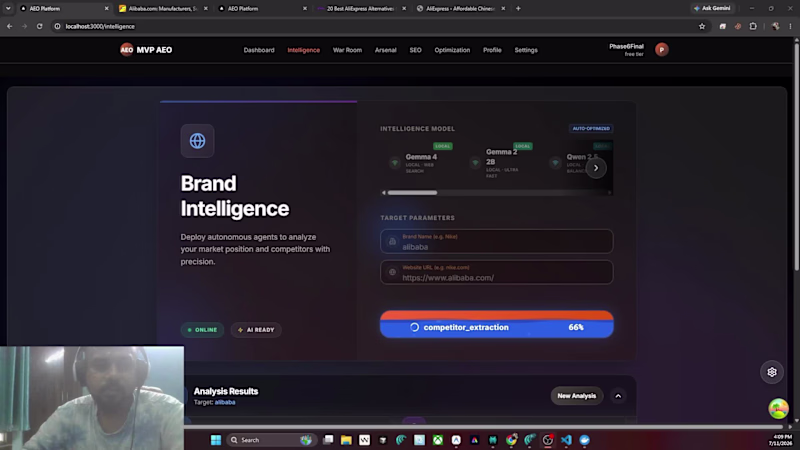
Business Intelligence Specialist | Power BI & Excel Expert
Business Intelligence Specialist | Power BI & Excel Expert