Power BI Data Analyst + ML AI Automation Expert
- 5.0
- Rating
- 101
- Followers
Power BI Data Analyst + ML AI Automation Expert
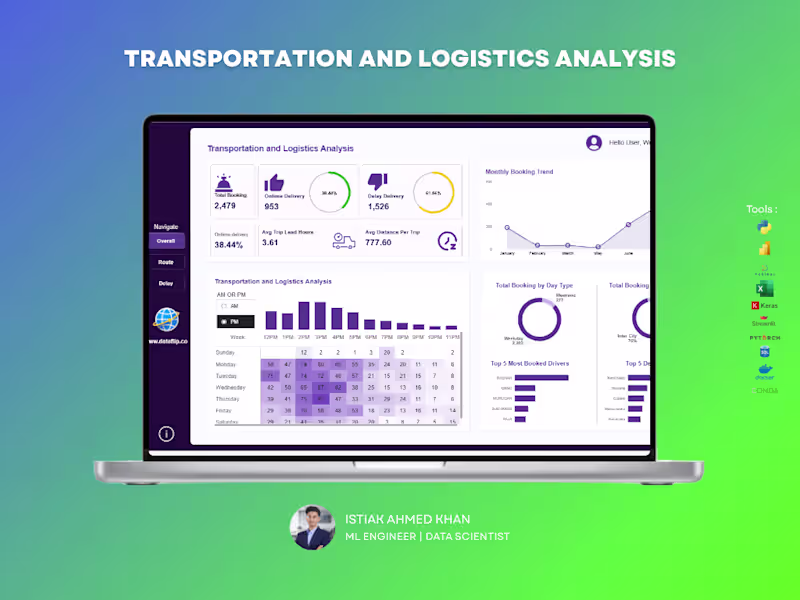
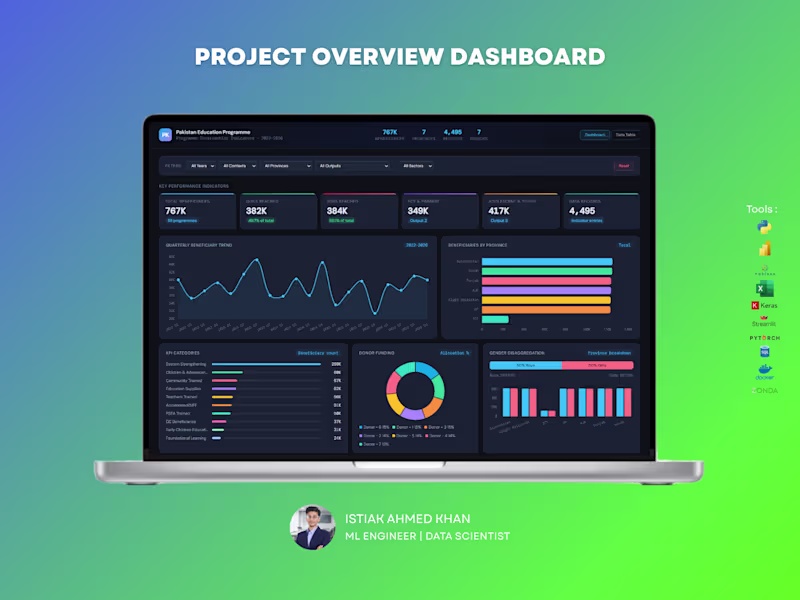
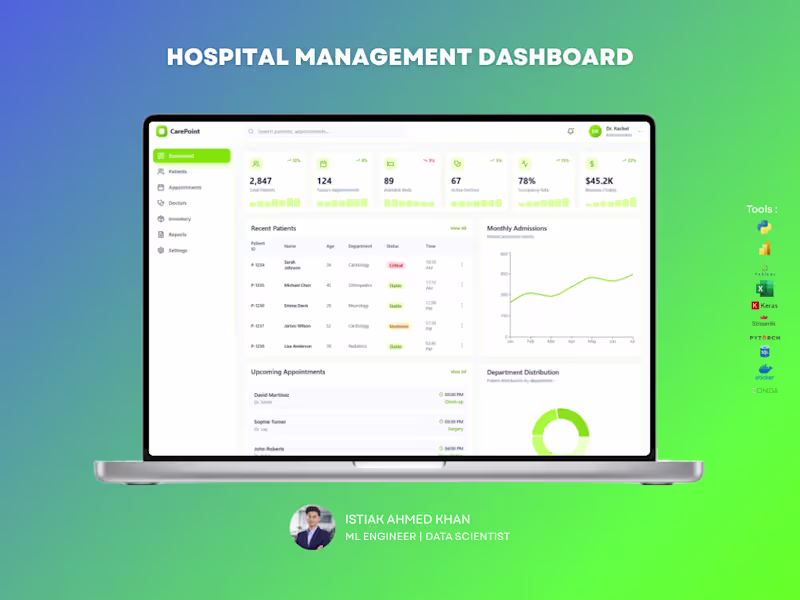

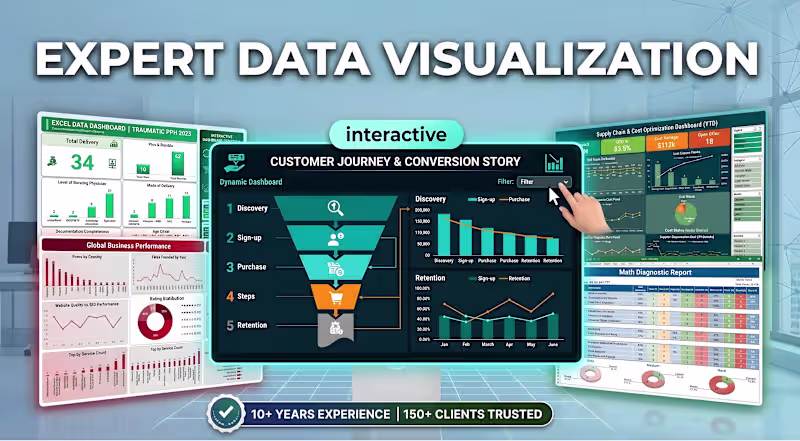
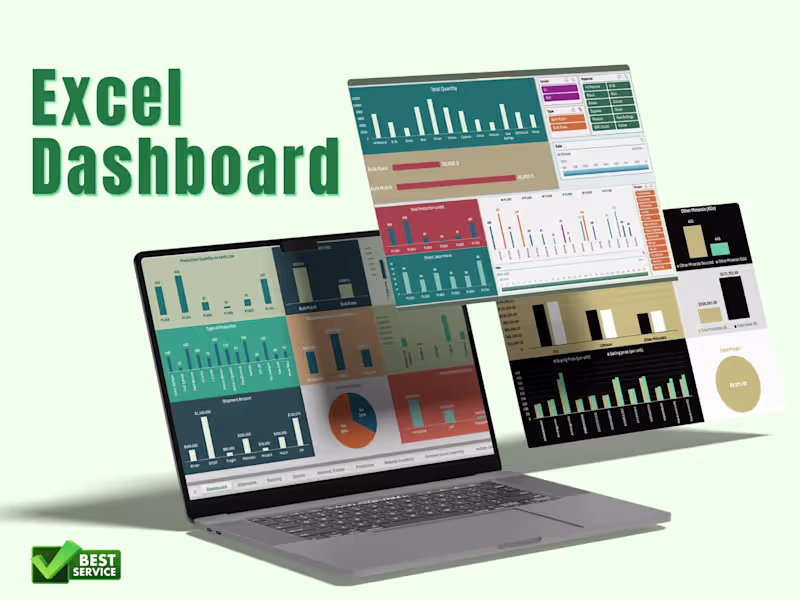
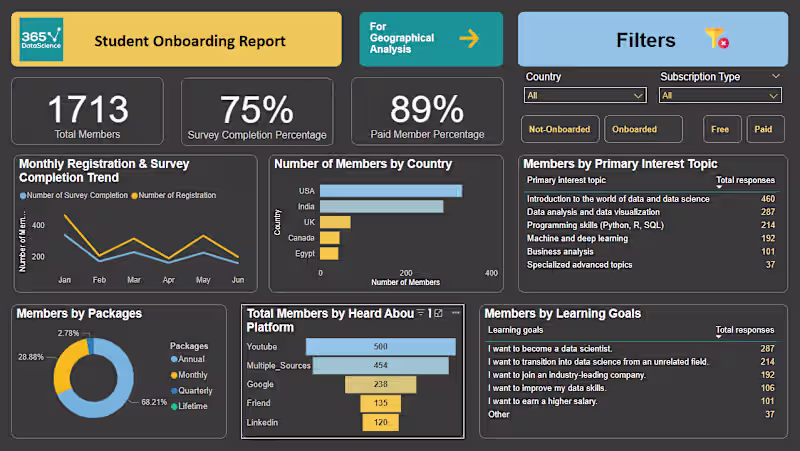
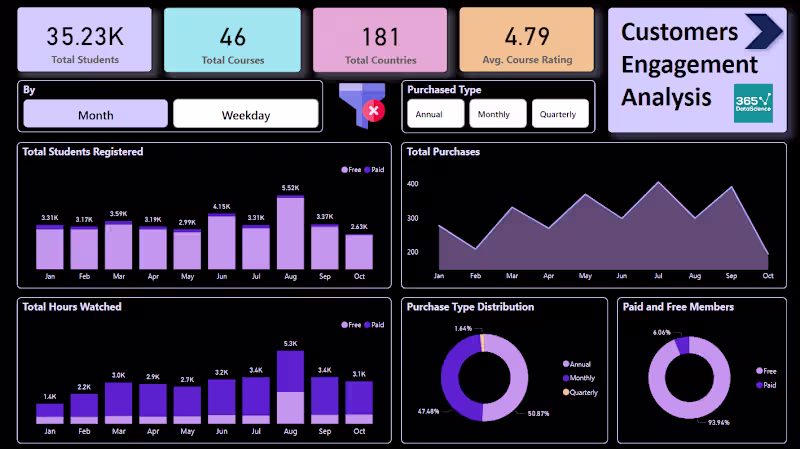
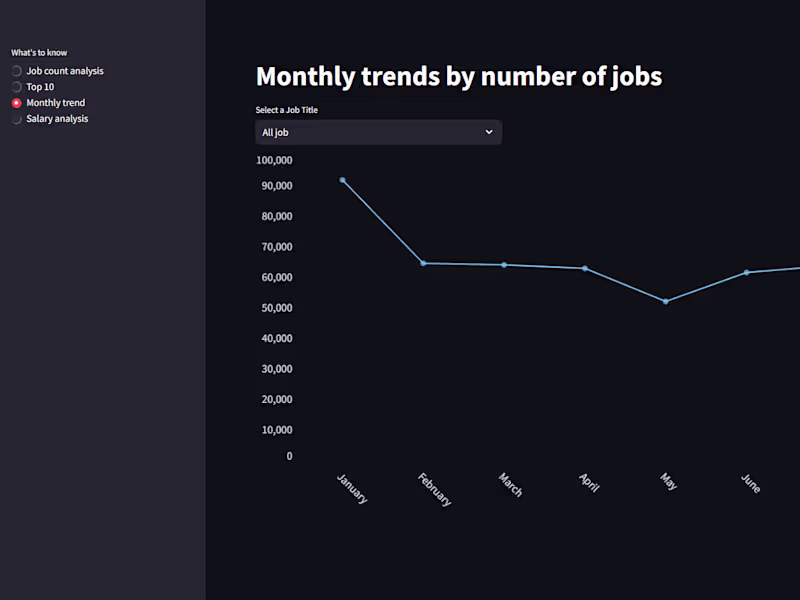
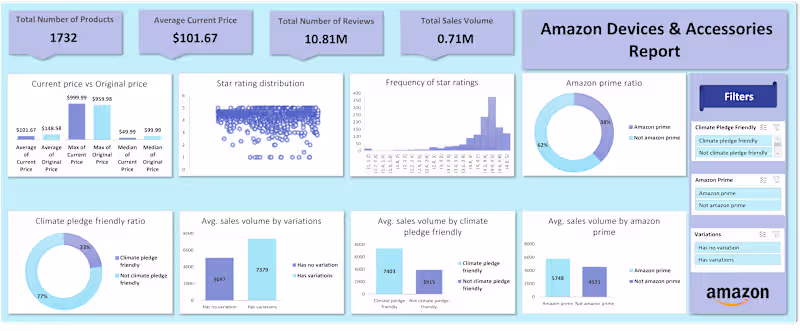
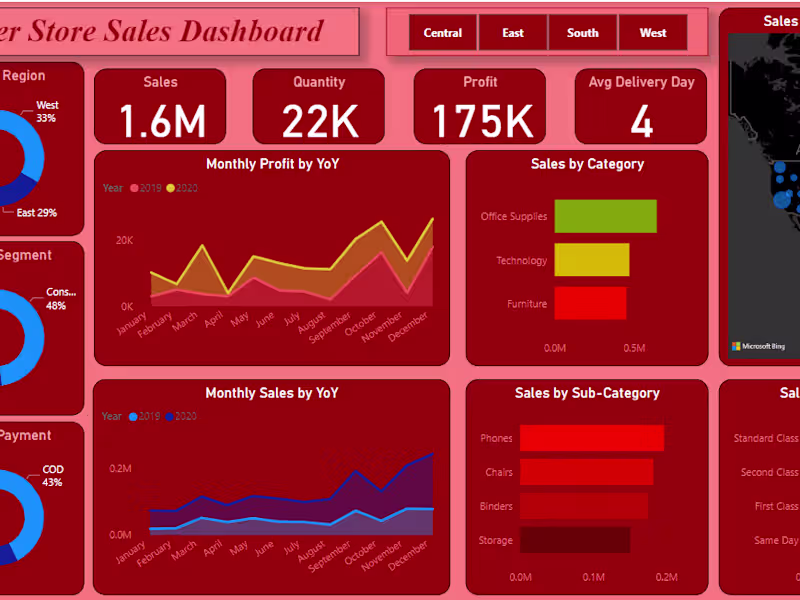
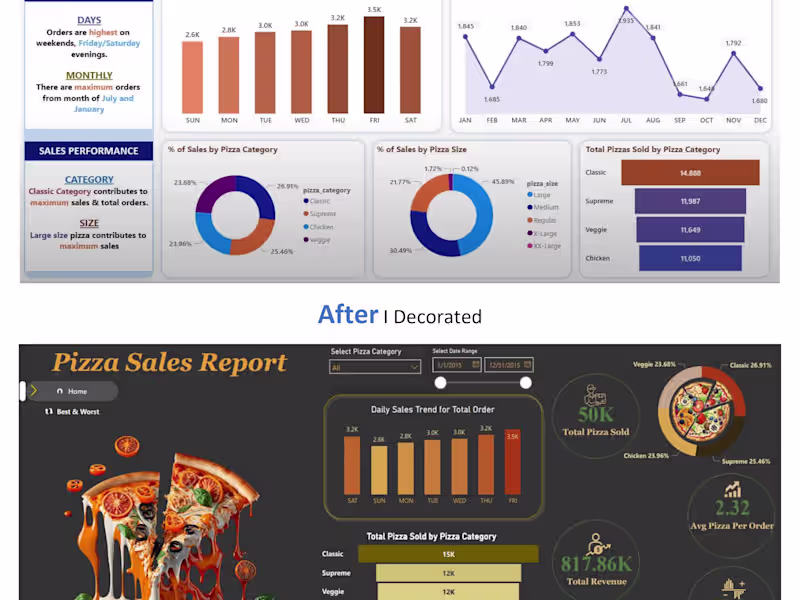
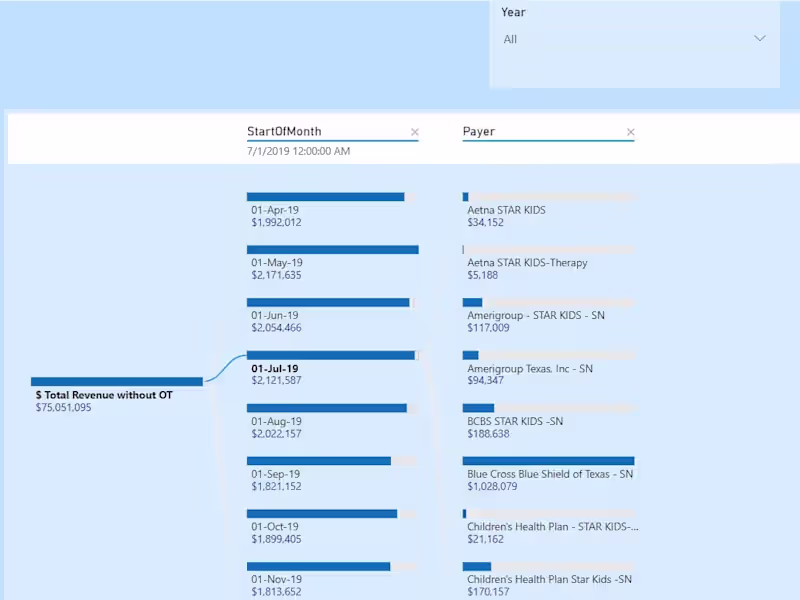
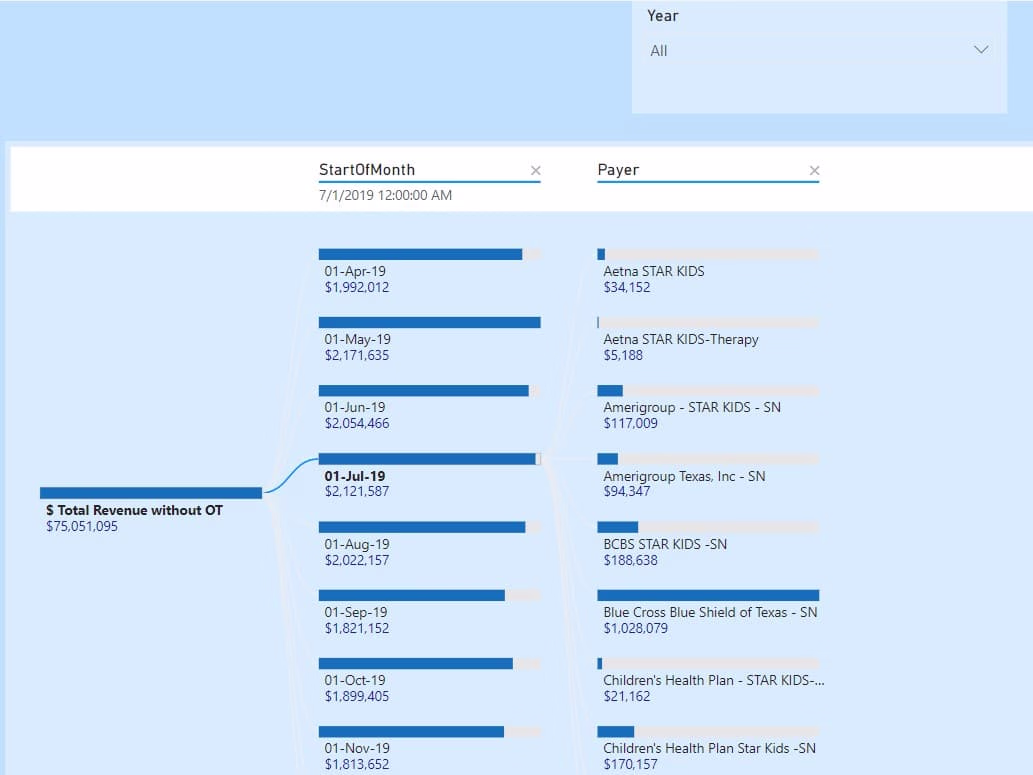
Data Analyst transforming raw data into actionable dashboard
Data Analyst transforming raw data into actionable dashboard


Global Product Sourcing, Conversion Optimization, BI Report


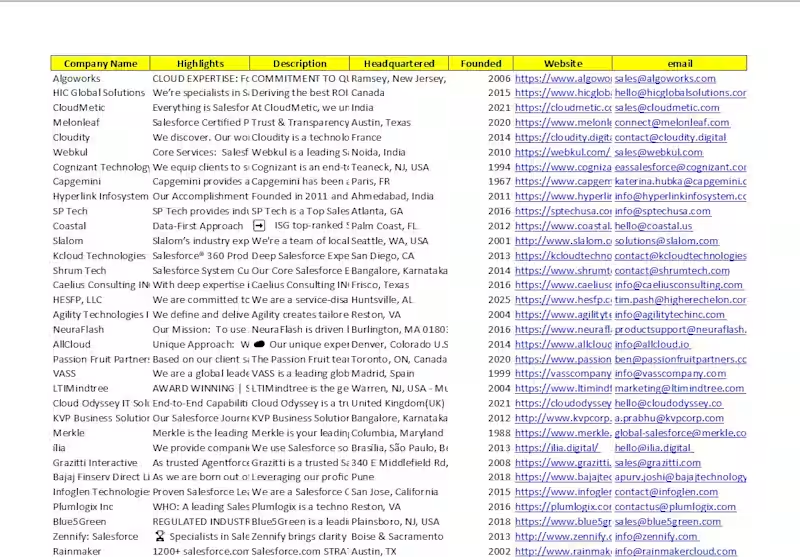
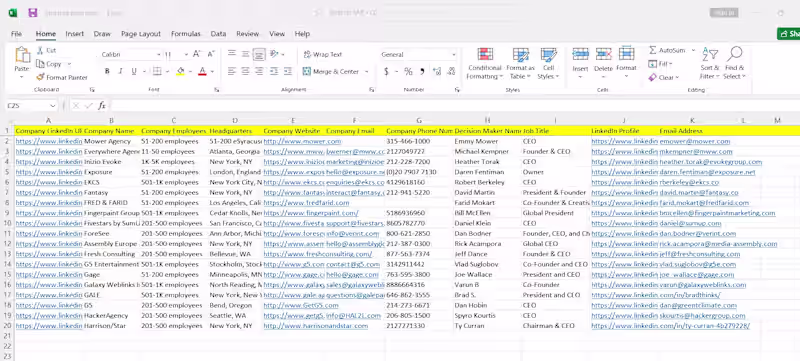
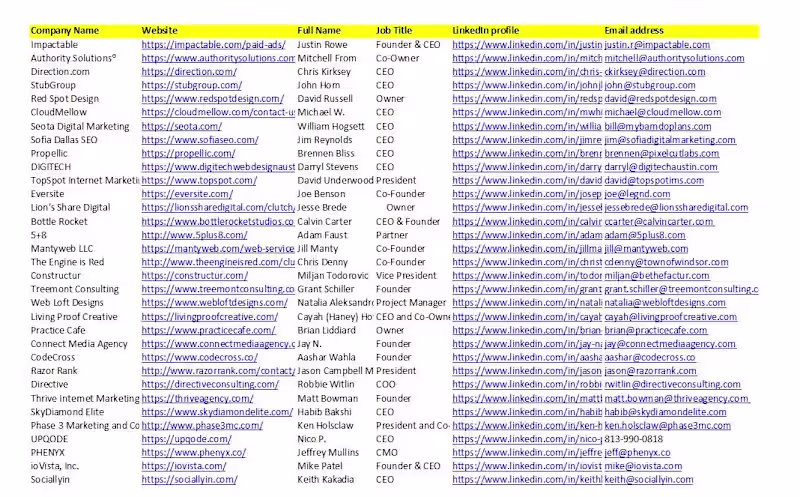
Data Entry, Lead Gen & VA Specialist | Accurate & Reliable
New to Contra
Data Entry, Lead Gen & VA Specialist | Accurate & Reliable
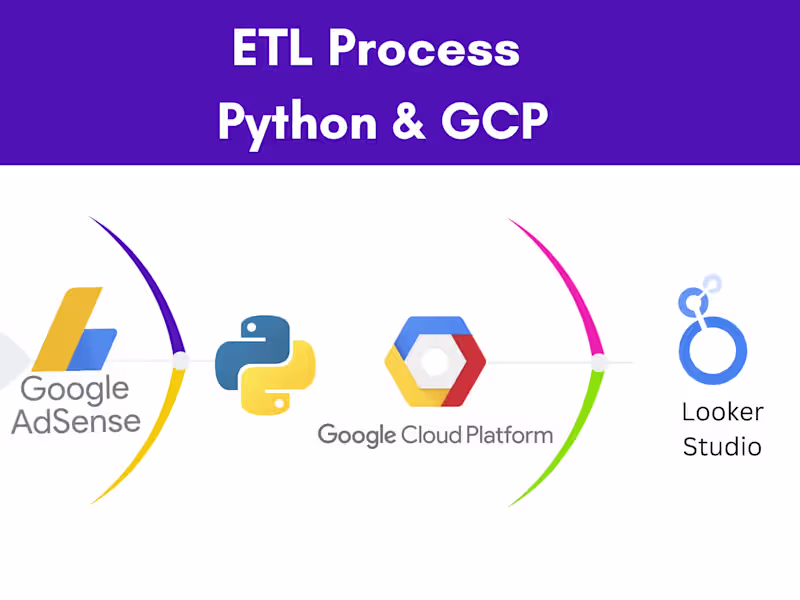
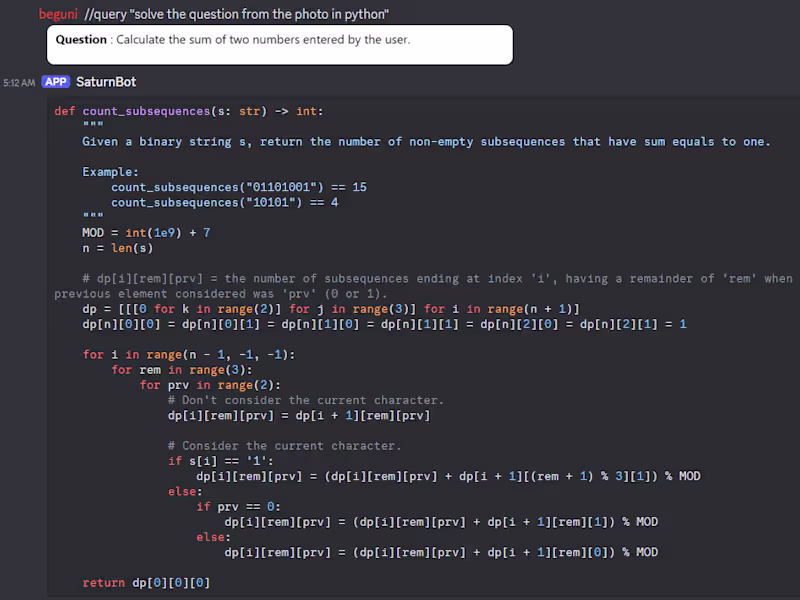
Data analyst | Python | SQL | Tableau | Excel | Power BI
Data analyst | Python | SQL | Tableau | Excel | Power BI
4+ Years Experienced Data Analyst & Visualizer
4+ Years Experienced Data Analyst & Visualizer


View more →
Web Development, Data Analytics and Digital Marketing
Web Development, Data Analytics and Digital Marketing

Data Analyst and Visualizers
Data Analyst and Visualizers