
Syeed Ponir
Data Analyst transforming raw data into actionable dashboard
Ready for work
Syeed is ready for their next project!
📈 Data is Everywhere. Insights Are Rare.
Is your market shifting faster than your strategy can keep up?
In today’s business landscape, relying on raw data or "gut feelings" isn’t enough. Having too much data without clarity leads to missed opportunities. To make better business decisions, you need to turn raw market intelligence into actionable business growth.
That is where I come in. 💼
With 10+ years of experience, I help businesses, founders, and executives crush their competition by delivering deep-dive market insights and comprehensive competitor analysis.
✨ What I Deliver:
Competitor Analysis Matrix: Uncover your competitors' strengths, weaknesses, and core strategies.
Deep-Dive SWOT & Trend Mapping: Spot industry shifts and market opportunities before anyone else.
Tailored Market Research: Validated intelligence customized directly to your specific niche.
Premium Executive Reports: High-impact, easy-to-digest PDF & Excel formats featuring clear data insights.
Stop guessing. Start executing with data-backed confidence.
🚀 Ready to scale? Let’s work together. Check out my services and portfolio, or DM me to order your comprehensive market research and executive report today!
0
34
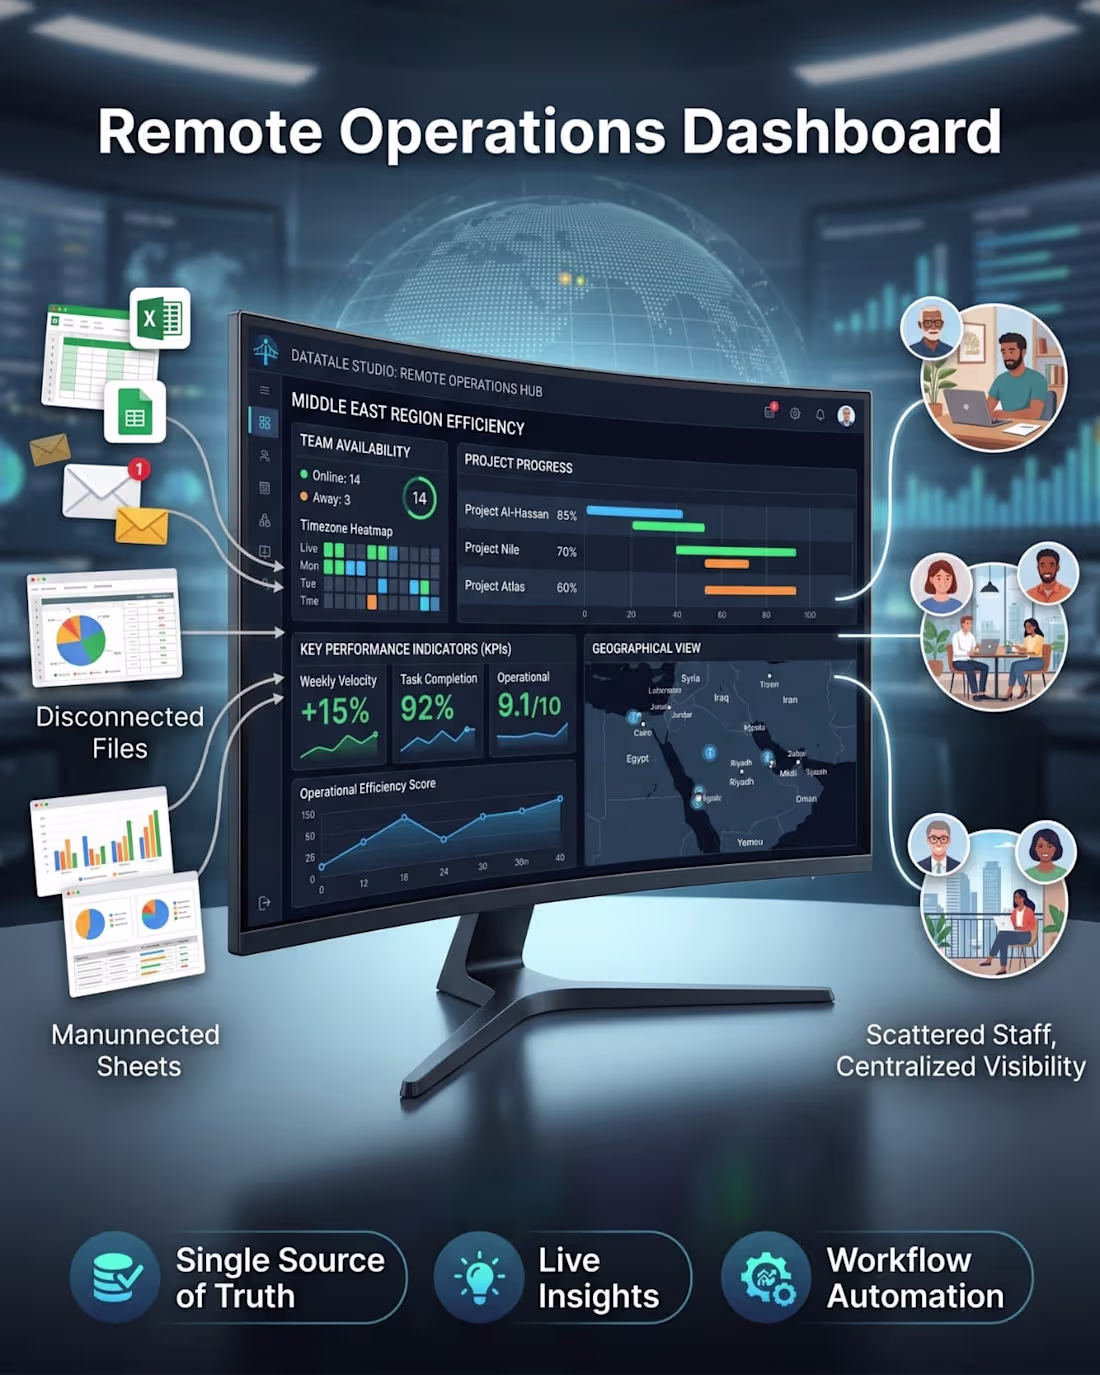
If your remote team still relies on spreadsheets for reporting — this project was made for clients exactly like you. 👇
🖥️ Project: Remote Operations Dashboard for a Middle East Operations Team
Here's the before and after:
BEFORE working with me:
❌ Data buried across disconnected files
❌ No live visibility into team availability
❌ Project updates delayed by days
❌ Leadership flying blind on KPIs
AFTER:
✅ 14 team members tracked live with timezone heatmaps
✅ 3 active projects visualized with real progress %
✅ KPIs automated: velocity +15%, task rate 92%, score 9.1/10
✅ Full geographical view of the distributed team
✅ One dashboard. Every answer. Instantly.
This is what I do — I turn operational chaos into clarity.
Whether you're a startup scaling fast or an established team going remote, I'll build you a dashboard that makes you look like you have a full data team behind you.
🟢 Currently available for new projects.
📩 Send me a message on Contra and let's scope your build.
🛠️ Services: Dashboard Design · Business Intelligence · Data Visualization · Remote Operations Systems · KPI Reporting
0
37
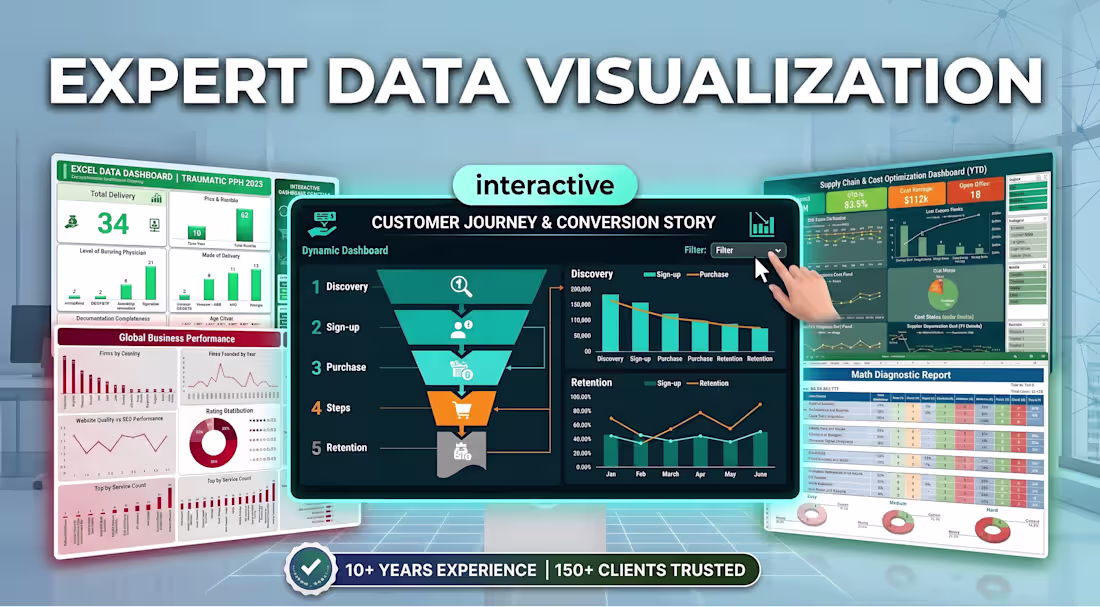
Data is only valuable if it tells a clear story. 📉
If you are tired of digging through static, confusing spreadsheets to find your KPIs, it's time for an upgrade. Welcome to DataTale Studio. I specialize in Expert Data Visualization, engineering interactive dashboards that turn complex, messy data into actionable insights.
Whether you need to map a Customer Journey funnel, track Global Business Performance, or optimize your Supply Chain, I build the exact visual systems you need to make fast, data-driven decisions.
What you get when we collaborate:
✔️ Interactive Dashboards: Filter, sort, and engage directly with your metrics in real-time.
✔️ Executive-Level Clarity: Clean, elegant designs that highlight the numbers that actually matter to your business.
✔️ Proven Expertise: Backed by 10+ years of data analytics experience and trusted by 150+ clients globally.
Stop guessing and start analyzing. If you are ready to transform your corporate reporting, check out my services and send an inquiry to start building your custom interactive dashboard today! 📊
1
97
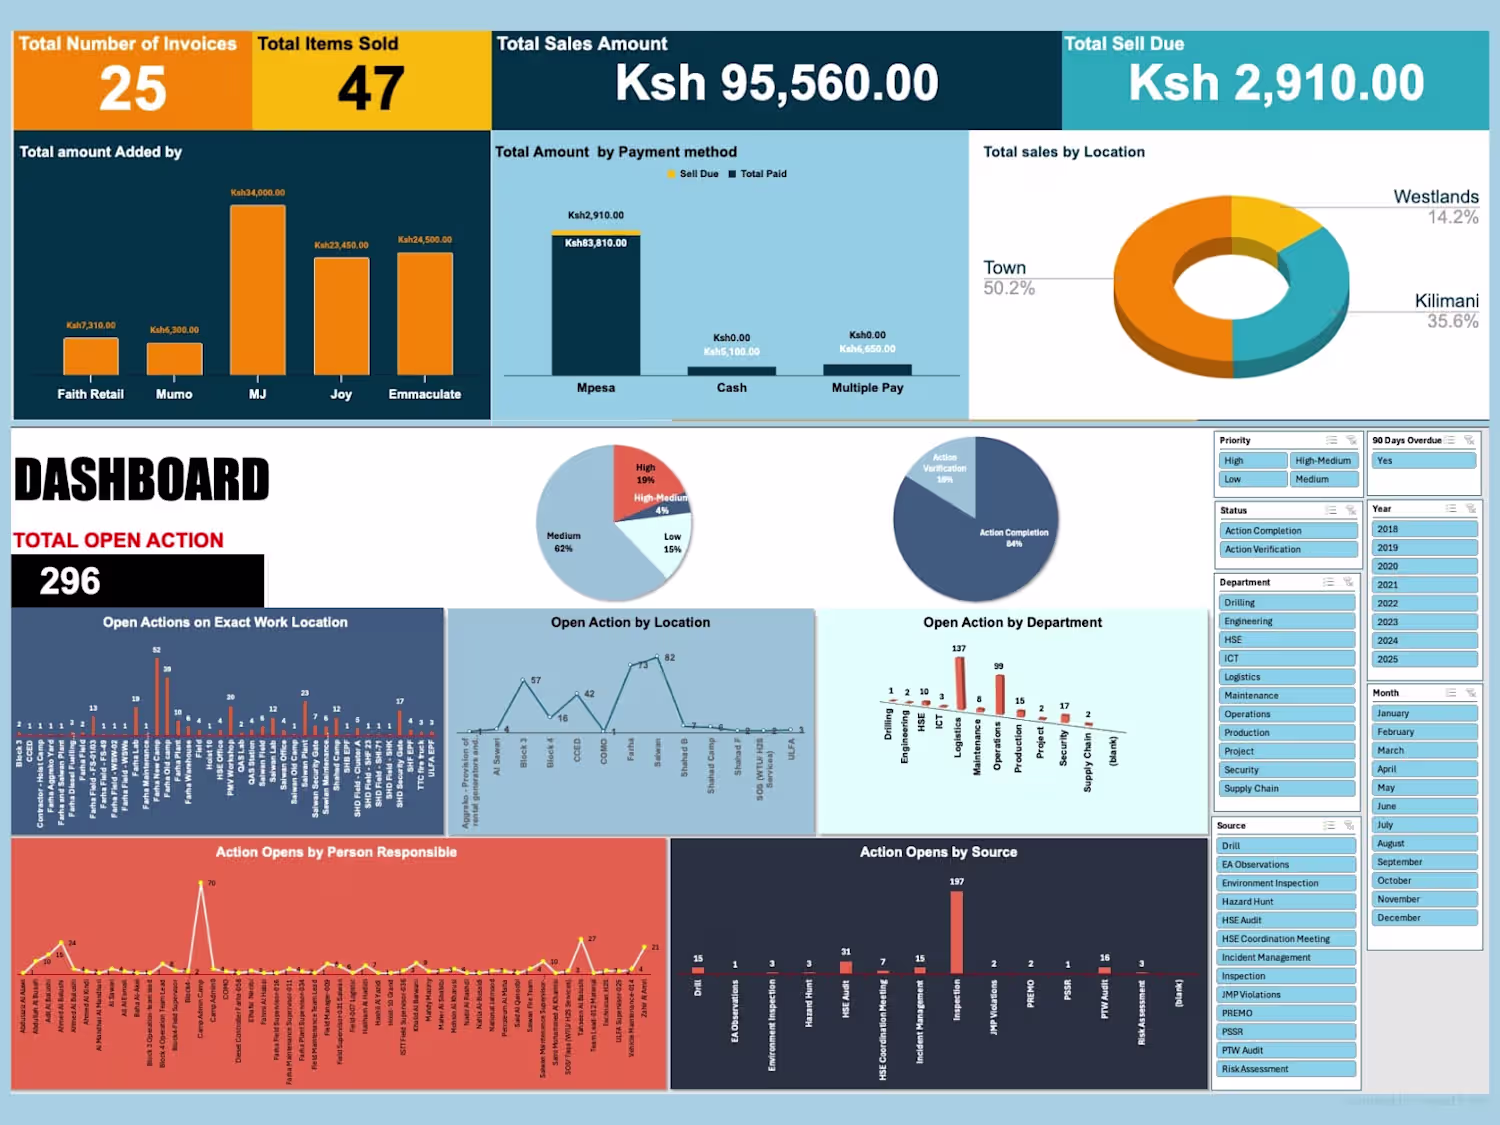
How to Turn Raw, Messy Data Into Powerful Business Insights 📊
If you are spending hours wrestling with complex spreadsheets, it’s time for a system upgrade. How do you bridge the gap between heavy data entry and strategic decision-making? By moving from static files to interactive, automated reporting.
At DataTale Studio, I specialize in transforming fragmented data into dynamic Excel dashboards that drive real business results.
The Transformation Process:
The Input: I take your raw data and build a robust backend using clean structures, complex formulas, and advanced DAX.
The Output: You receive a modern, clean dashboard featuring custom charts, advanced pivot tables, and vibrant data visualization.
Why collaborate with DataTale Studio?
Actionable Insights: Replace confusing rows of numbers with clear, visual metrics.
Dynamic Reporting: Interact directly with your data to spot trends instantly.
Satisfaction Guaranteed: I offer unlimited revisions to ensure your custom dashboard perfectly fits your workflow.
Stop guessing and start analyzing. If you are ready to streamline your business reporting, let's get to work. Send an inquiry today to discuss your custom data visualization project! ⚙️
9
6
300
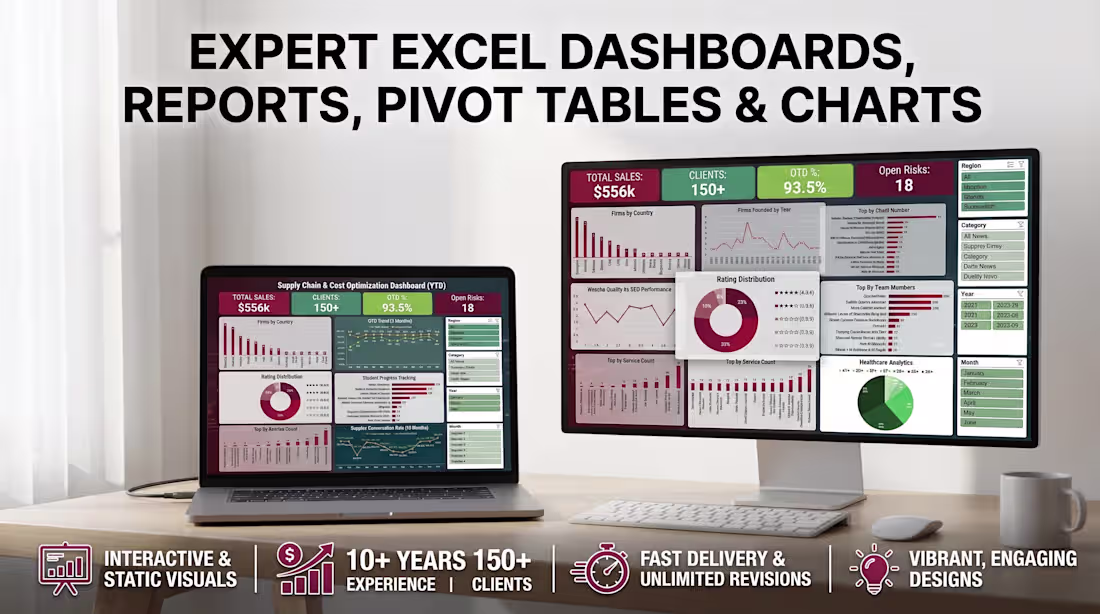
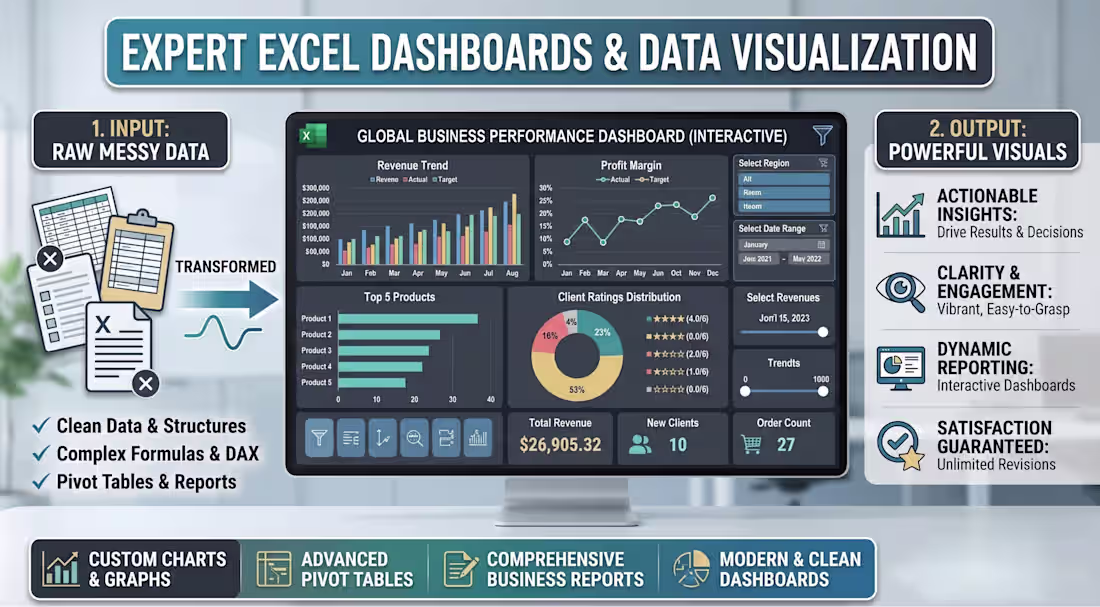
Need clear business insights fast? Let’s upgrade your reporting. 📉
I build expert Excel dashboards designed for true operational clarity. Whether you need interactive pivot tables, dynamic charts, or comprehensive executive reports, DataTale Studio delivers premium data visualization tailored to your exact needs.
What you get when we collaborate:
🔹 10+ Years of Data Experience (150+ clients and counting)
🔹 Engaging, high-end visual solutions
🔹 Fast delivery with unlimited revisions to ensure absolute accuracy
If you're tired of digging through raw data to find your key metrics, let's get to work. Send an inquiry to start your custom dashboard project today! ⚙️
2
128
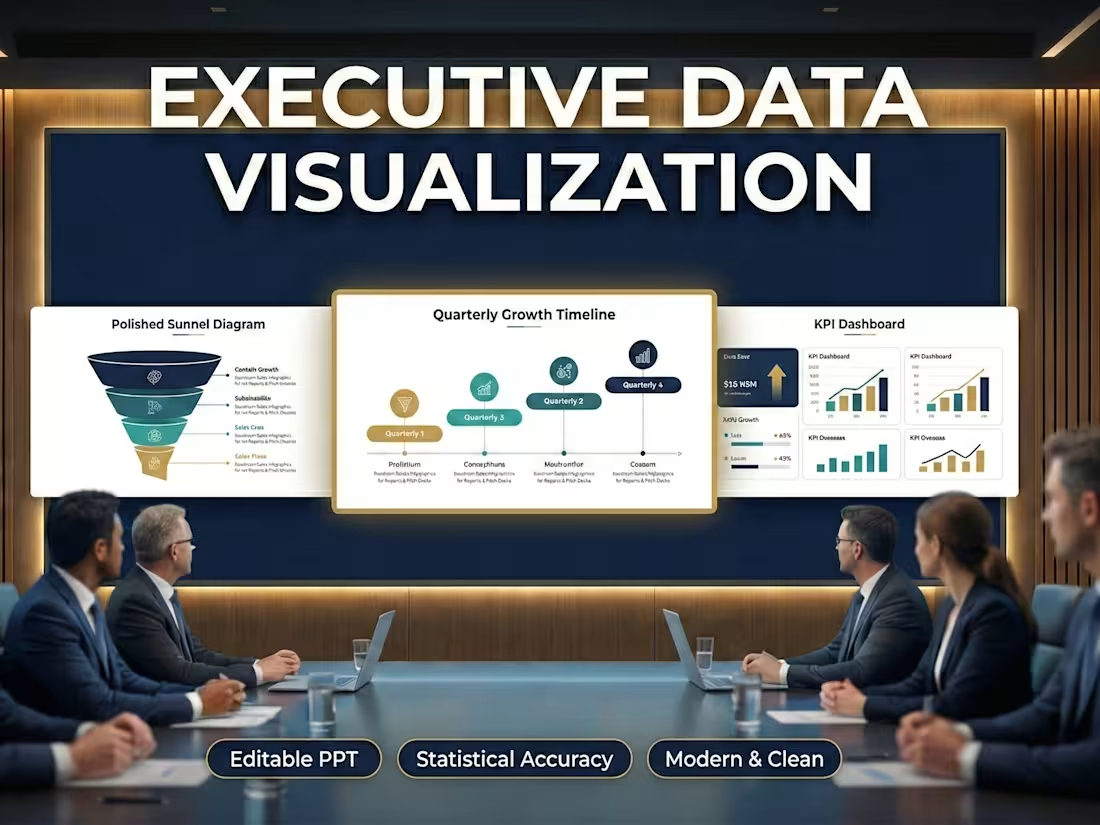
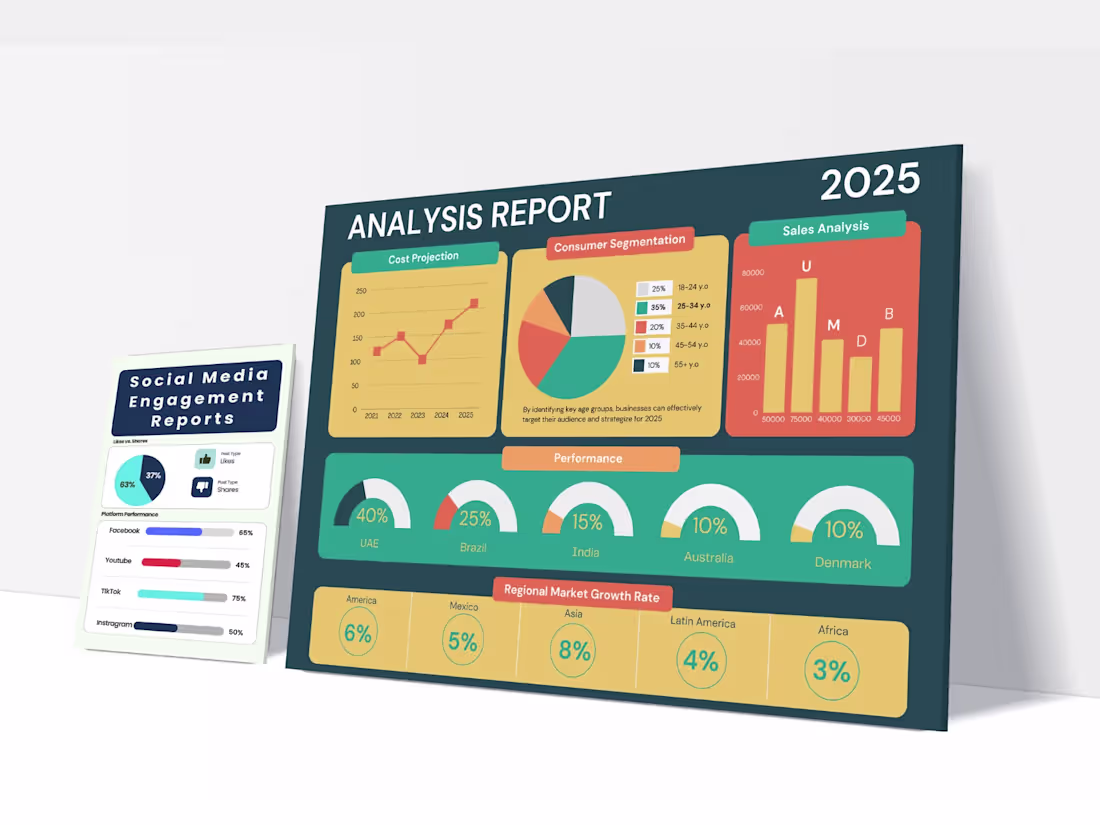
📈 Executive Data Visualization for Business Reports
Stop presenting boring spreadsheets. Your data has a story to tell, and I design the visuals that make investors and executives listen.
I transform raw numbers into clean, modern, and mathematically accurate infographics that drive decisions instantly.
What you get:
Boardroom-Ready Visuals: Polished charts, KPI dashboards, and funnel diagrams.
Complex Frameworks: Clear flowcharts, timelines, and organizational maps.
Flexible Delivery: High-res PDFs and fully editable PowerPoint files.
Lose the clutter and keep their attention. Let's build your next report!
Message me today to get started.
3
92
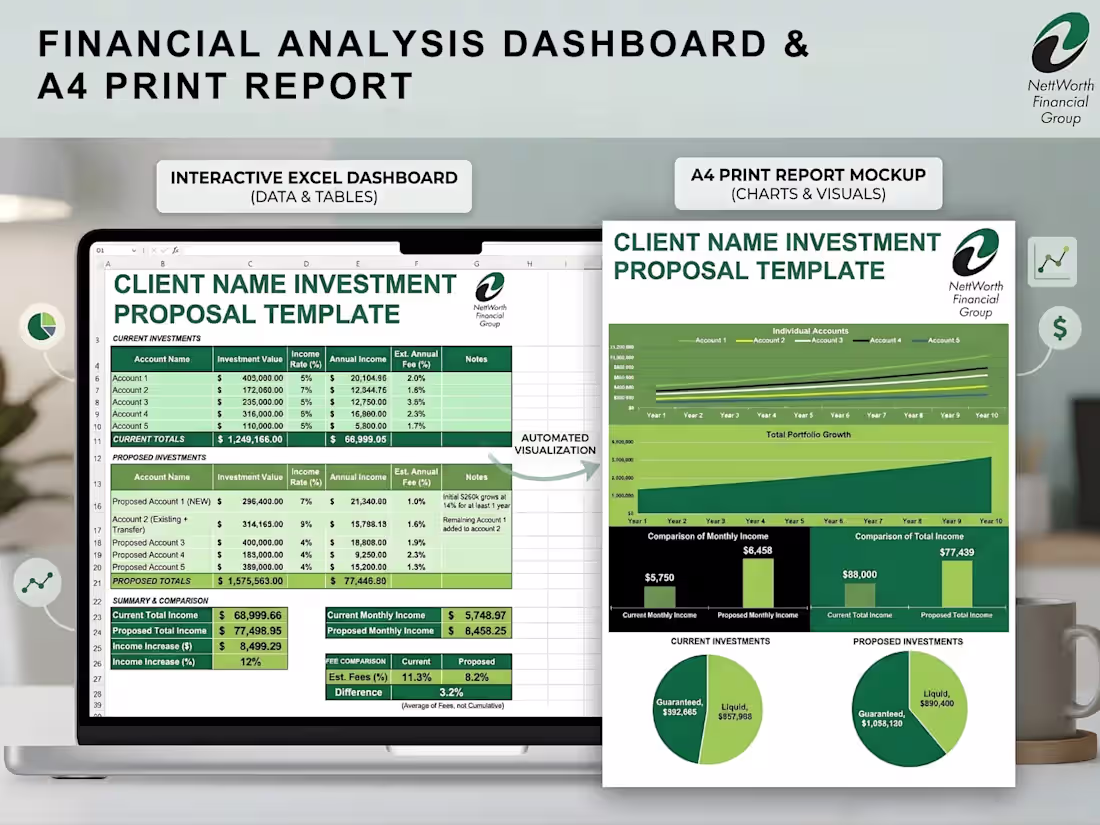
Transform Your Data into Actionable Insights 📊
Stop settling for messy spreadsheets. I specialize in building custom, interactive dashboards that not only track your key metrics in real-time but also seamlessly translate into stunning, presentation-ready PDF reports.
Whether you need to monitor daily operations or pitch a financial proposal to a high-ticket client, I bridge the gap between raw data and professional design.
🛠️ What I Built:
Business & Revenue Reports: Track YTD pacing, profitability margins, and 12-month rolling trends with clear visual hierarchies.
Financial Investment Proposals: Automated systems that turn standard data entry into comprehensive, highly visual portfolio growth projections.
Modern Lead Trackers (Google Sheets): Keep a pulse on sales rep performance, conversion rates, and pipeline health.
Operational Error Tracking: Dynamic issue-logging systems sorted by department and location to quickly identify bottlenecks.
✨ Key Features of My Dashboards:
Dual-Format Delivery: Fully interactive digital workspaces (Excel/Google Sheets) paired with automated, perfectly formatted A4 PDF print outputs.
Automated Visualizations: Type in your raw data, and watch the charts, graphs, and summary cards update instantly.
Clean UI/UX: Professional, brand-aligned designs that make complex data easy to digest for stakeholders and clients.
Ready to upgrade your reporting and save hours of manual formatting? Let’s collaborate and build a custom data solution tailored to your business needs!
#DataVisualization #ExcelDashboards #GoogleSheets #Reporting #FreelanceDataExpert #BusinessAnalytics
2
5
164
Corporate Infographics: Visualizing Complex Business Data.
0
62
Contact me to get your pitch deck ready.
0
62
Is "Kinetic Type" the future of paid social? 🤔
We are seeing a massive shift in what works for paid media. The polished, cinematic commercials are taking a backseat to raw, fast-paced, text-driven content.
Why? Because 85% of videos are watched on mute.
DM me if you need ads that actually convert. 📩
Hashtags: #MotionGraphics #FreelanceEditor #AdStrategy #Creative #GrowthMarketing
0
55
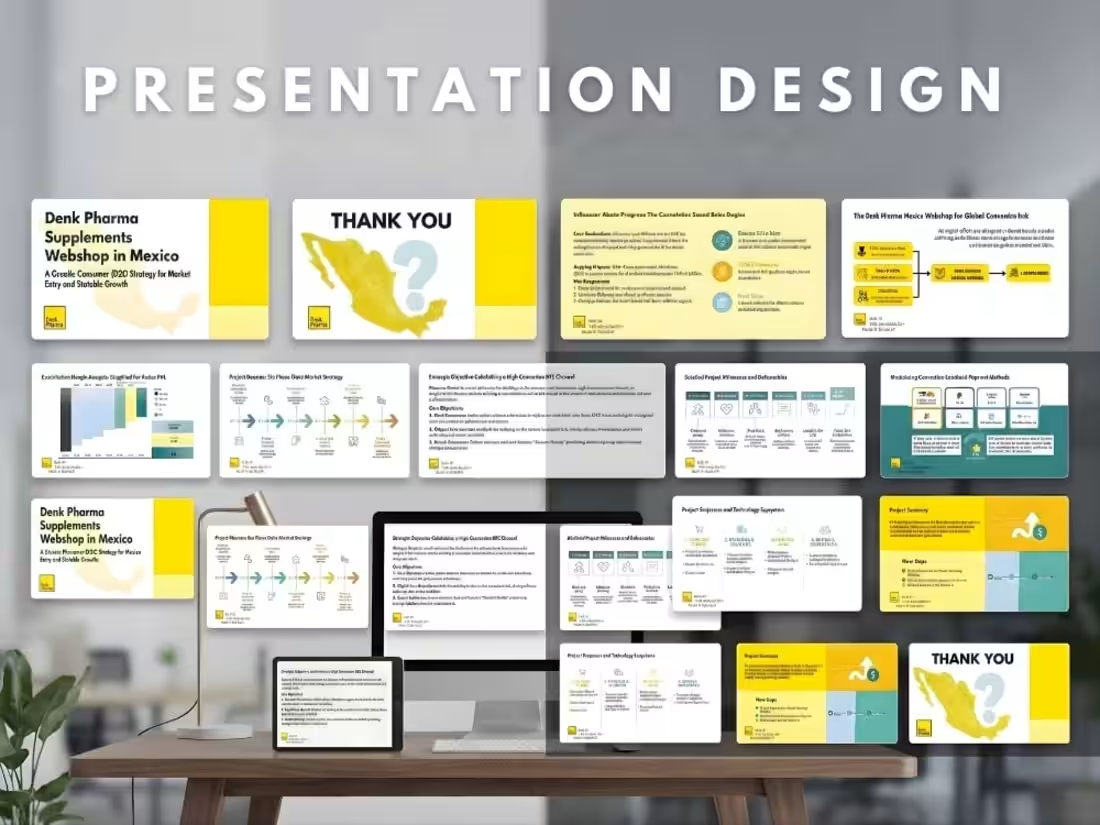
Modern Investor Pitch Deck Design
0
1
My goal is to take your static assets and turn them into a memorable brand experience. From concept to final render, I handle the animation and sound design to ensure your videos start with a bang.
Includes:
4K Quality
Fast Turnaround
Unlimited Revisions during the design phase
Shoot me a DM or check my Services to view pricing! 📩
1
92
Excel to video Presentation.
2
101
Is your complex data losing its impact?
Do you need a powerful way to explain insights and drive decisions with engaging video?
1
95
Corporate Reports and Data Presentation
1
3
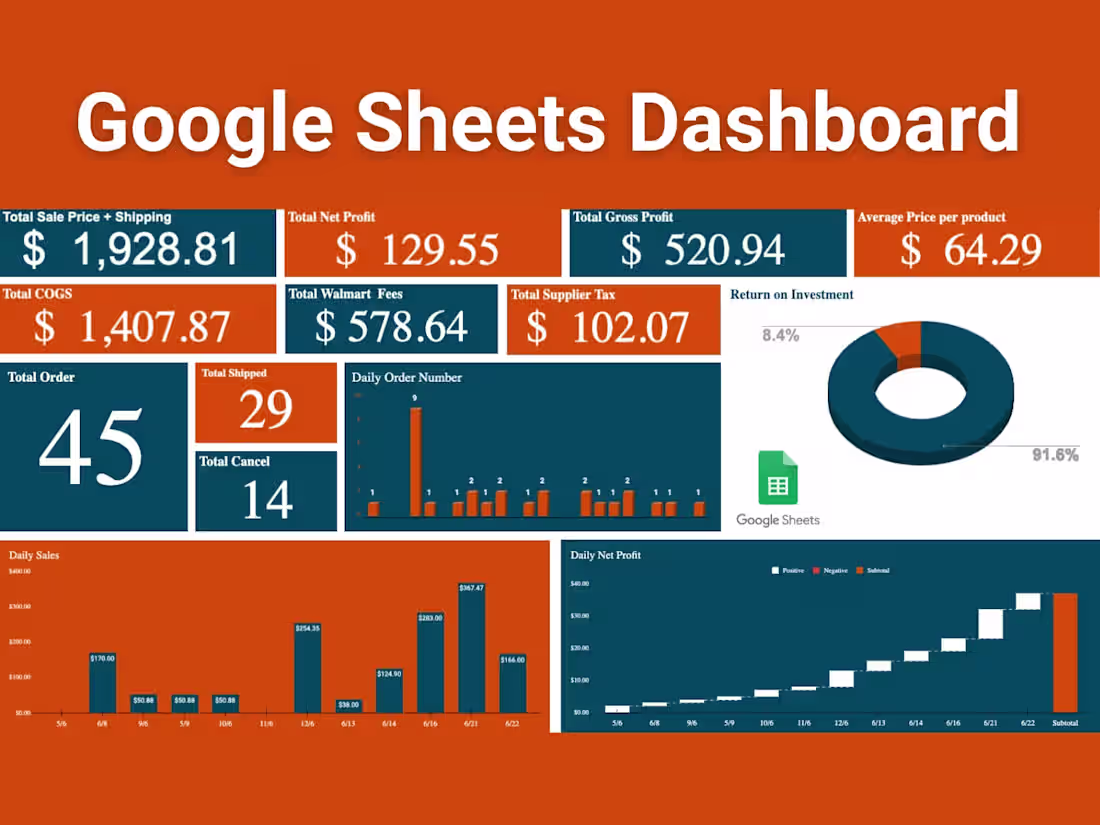
Google Sheet Dashboard
1
5
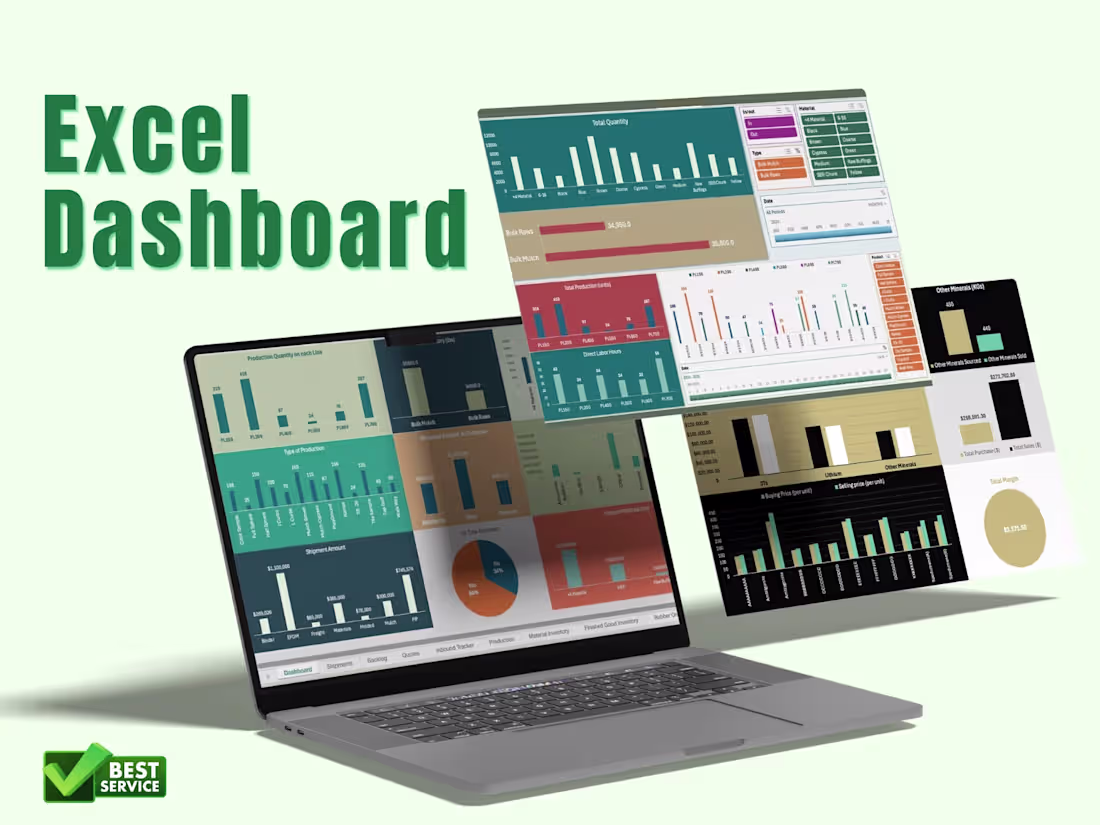
Excel charts and Dashboards
1
4