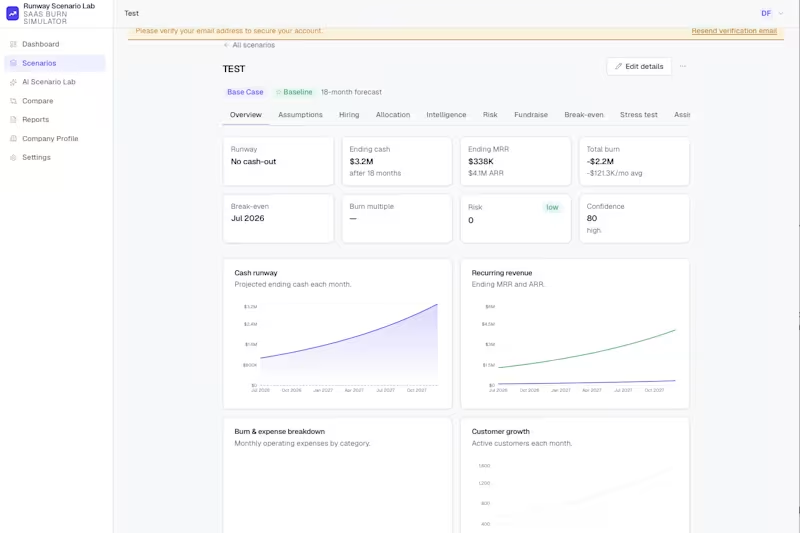
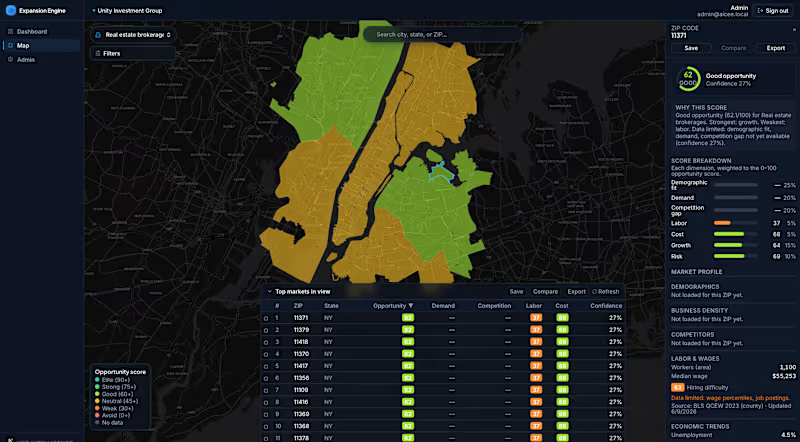
Data Analysis Projects in BowieData Analysis Projects in BowieUsers enter a SaaS financial baseline (cash, MRR/ARR, margin, expenses, churn, headcount) and generate baseline and custom scenarios across 12-36 month forecasts. A centralized engine computes monthly cash, MRR/ARR, burn, runway, CAC payback, LTV:CAC, burn multiple, and break-even for each scenario, with deterministic risk and confidence scores. Users adjust assumptions and hiring plans with live recalculation, compare 2-4 scenarios, run a fundraise-timing predictor, a break-even path finder, and stress-test mode, then generate editable board reports exportable to PDF or share links. An AI decision assistant explains scenarios using only calculated outputs. The platform turns fragmented location data into one industry-specific opportunity score per ZIP code. A user selects an industry, searches a region or scans nationwide, and sees color-coded ZIP opportunity zones on a map. Clicking a ZIP opens a breakdown across demographic fit, demand, competition gap, labor availability, cost, growth, and risk, each weighted per industry, plus an AI explanation grounded in the stored inputs. Users can filter, rank, save, compare markets, and export reports. Scores carry confidence levels so missing data lowers confidence instead of fabricating precision. As a designer, I focused on crafting an experience that brings clarity to complexity. This project embodies the future of intelligent stadium management and sets a new standard in how we interact with data at scale.
This bird’s-eye view gives an effortless preview of how data flows across the venue, highlighting availability, network performance, and traffic patterns, helping managers ensure smooth operations for thousands of spectators.
Through motion-driven design, complex data is turned into meaningful insights. Dynamic, color-coded charts and intuitive visuals reduce cognitive load, offering clear, actionable information, like network status, crowd accessibility, and engagement - at a glance.
The real power of this animation lies in its ability to provide contextual insights at scale, enabling proactive decision-making.