Projects using Microsoft Power BI in Bengaluru
Projects using Microsoft Power BI in Bengaluru
Sign Up
Post a job
Sign Up
Log In
Filters
2
Projects
People
Message
1
SUDHAN Baskaran
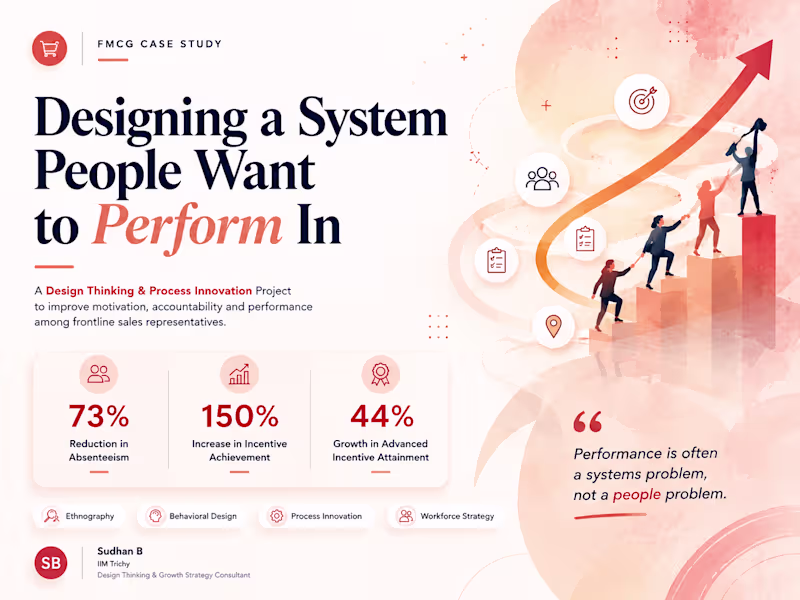
A 73% reduction in absenteeism without increasing salaries. Sounds unlikely.: But after observing frontline FMCG sales representatives for two months, the real issue became clear: The problem wasn't the people.: It was the system they worked in.: This case study shows how ethnography, behavioral design and process innovation transformed motivation, accountability and performance at the ground level.🚀
1
179
Message
0
Varun Walekar
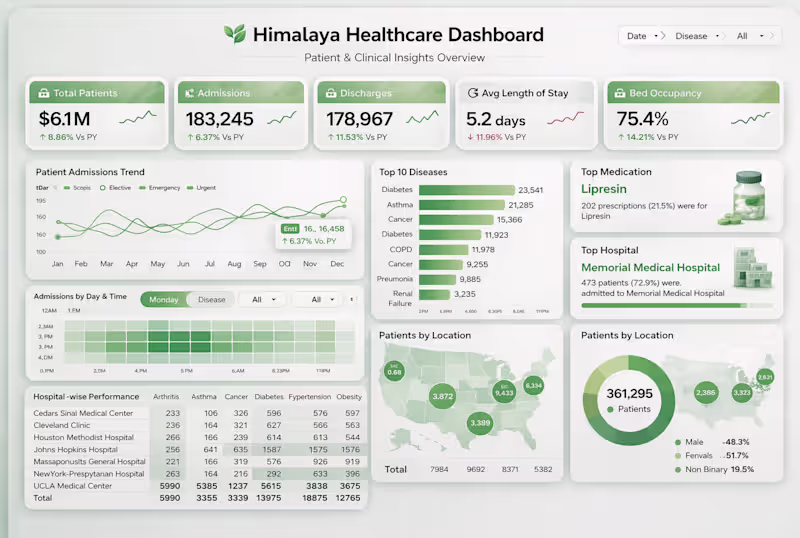
From Chaos to Clarity: Healthcare Dashboard in Power BI 1. Clean and interactive Power BI dashboard for tracking patient trends, hospital performance, and key healthcare metrics in one place. 2. A modern healthcare analytics dashboard built in Power BI to monitor admissions, diseases, and operational efficiency. 3. Turn raw healthcare data into meaningful insights with this intuitive and fully interactive Power BI dashboard.
0
42
Message
0
Ismail Basha Shaik
Data Analysis
0
2
Message
0
Jeevan V
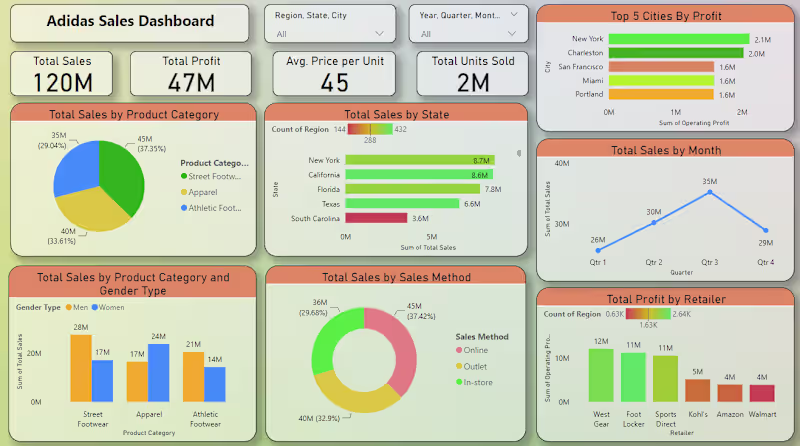
Power BI Sales & Performance Dashboard
0
1
Message
0
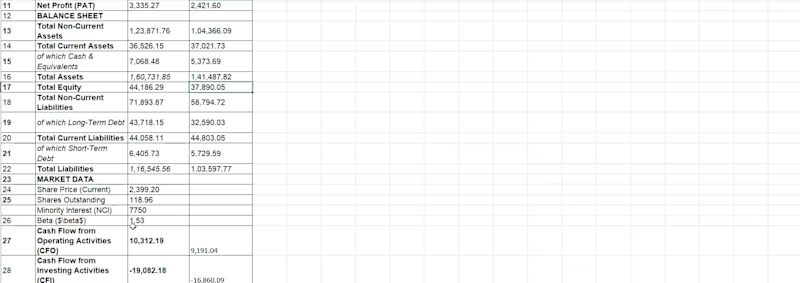
Aditya Singh
Role: Financial Analyst Description: Created a comprehensive Discounted Cash Flow (DCF) and ratio analysis model to contrast the financial health of two distinct business models (Adani vs. CBRE). This involved detailed valuation, sensitivity analysis, and strategic forecasting. Tools: Advanced Excel, Bloomberg Terminal, Financial Modeling. Impact: Delivered a structured comparison used for strategic investment recommendations.
0
19
Message
0
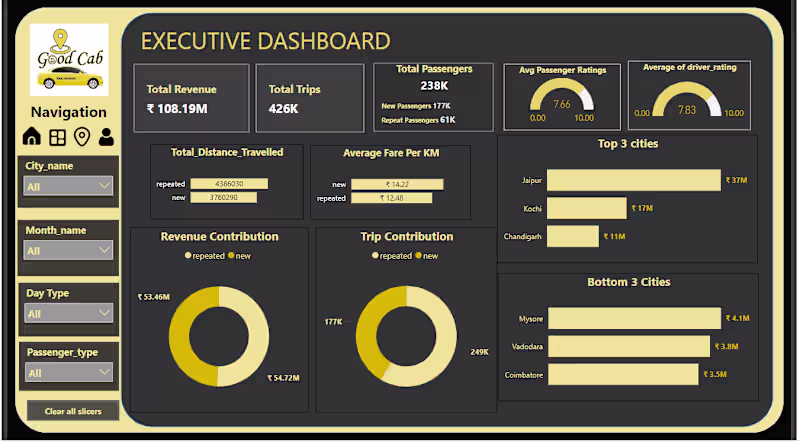
vidya mallya
Good Cabs Performance Dashboard
0
2
Message
0
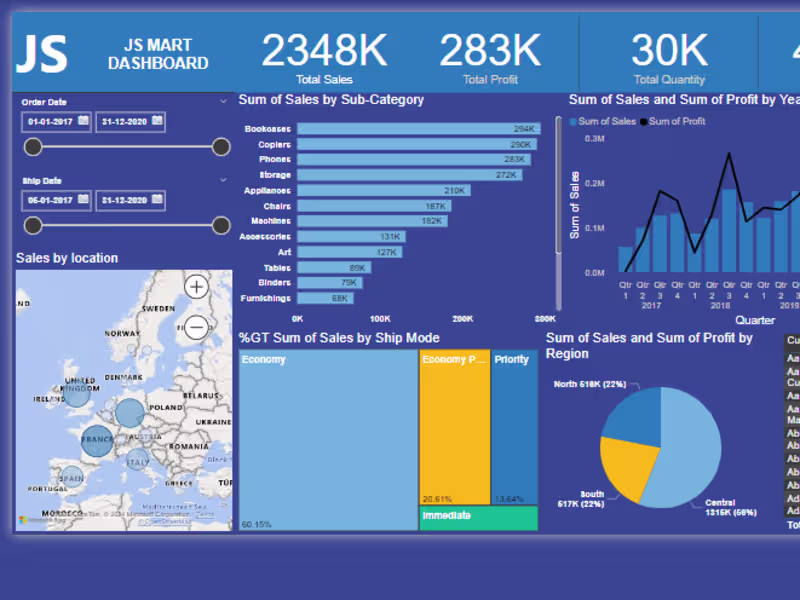
Jacob Stephen
Power BI Dash Board JS Mart, Example
0
10
Message
0
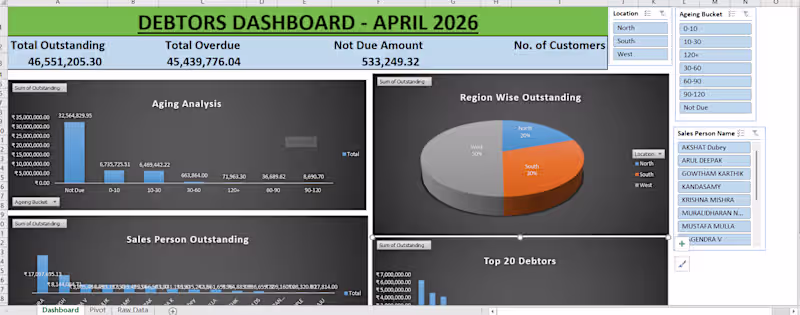
Neeraj S
ACCOUNTS RECEIVABLE DASHBOARD & COLLECTION TRACKER
0
25
Message
0
Yash Soni
Unified Reporting System for Data-Driven Insights
0
12
Message
0
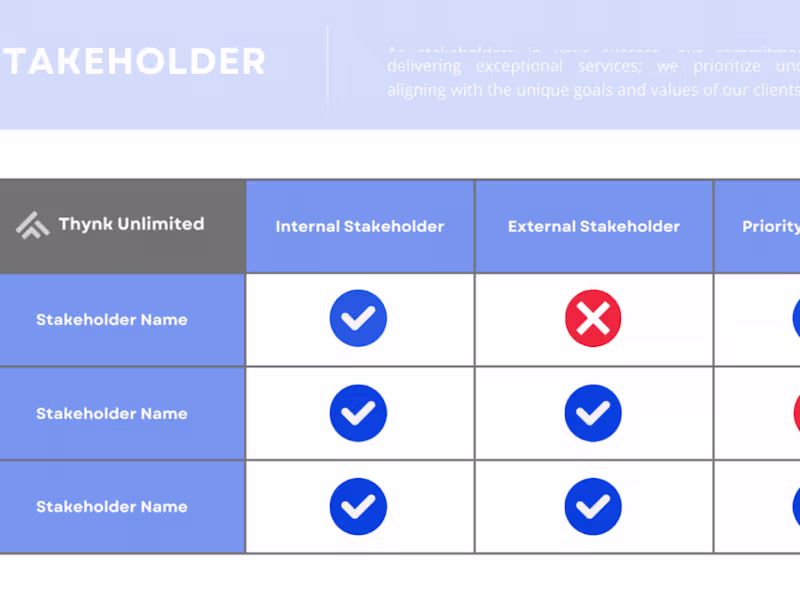
Zafrulla Rasheed
Workforce of the future
0
1
Message
0
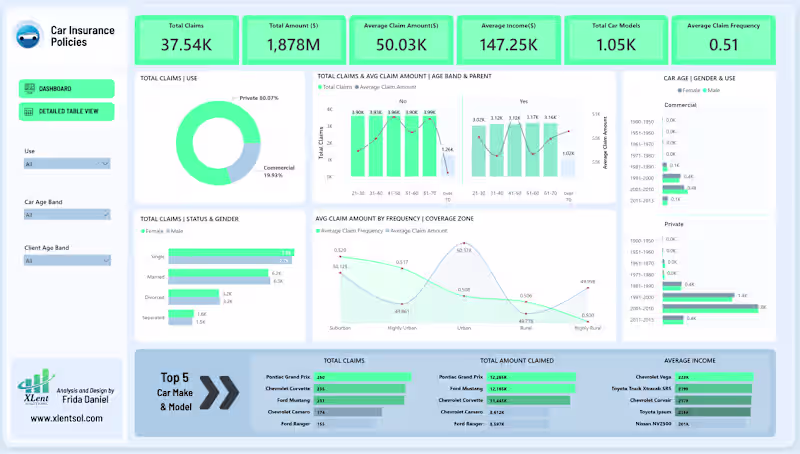
Frida Daniel
Car Insurance Policies Power BI Dashboard
0
531
Message
0
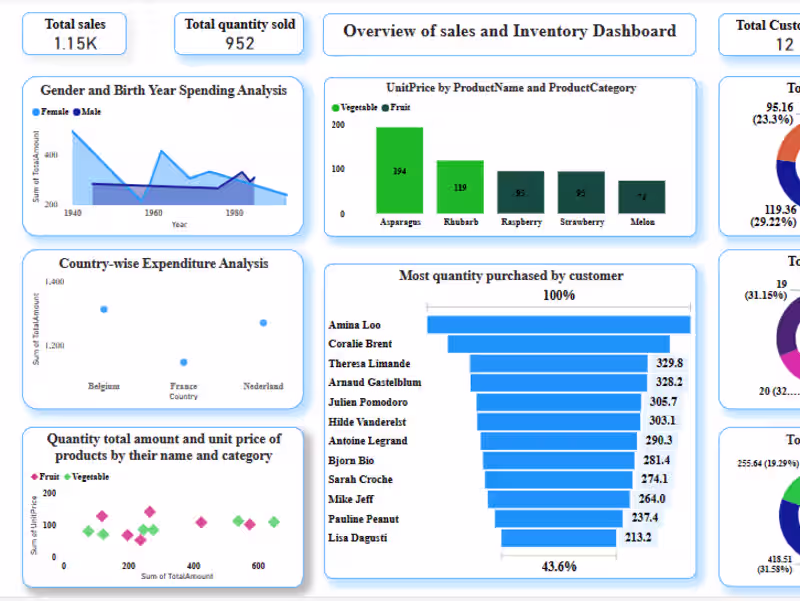
Smarty Mukherjee
CheckMate|Data Visualization from 2 sources
0
6
Message
0
Ganesh Chandra
Production Process Optimization and Efficiency Improvement
0
7
Message
0
Shaik Reddy Shareef
Inventory Report Using Power BI
0
2
Message
0
Bishal Paul
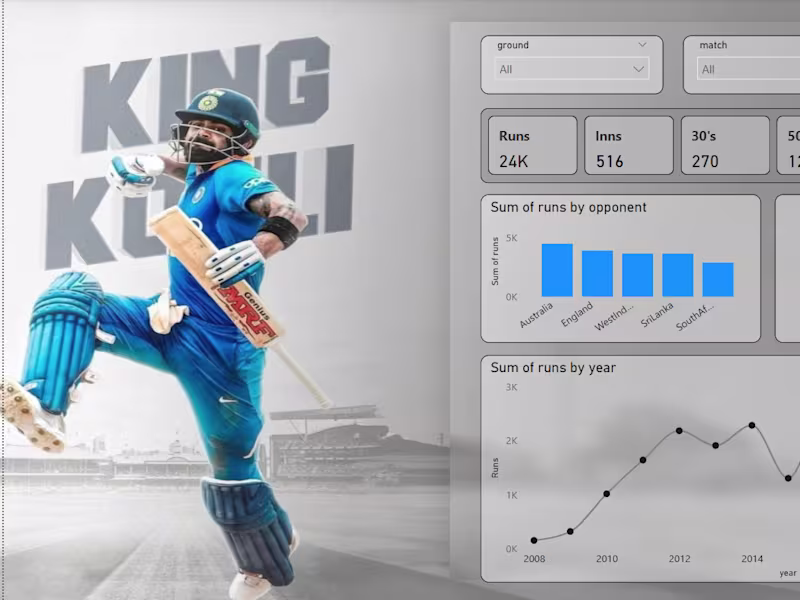
Power BI Cricket Dashboard - Virat Kohli Career Analysis
0
2
Message
0
Shiva Singh
Advanced Excel Specialist: Data Analysis and Automation
0
0
Explore projects