Good Cabs Performance Dashboard
vidya mallya
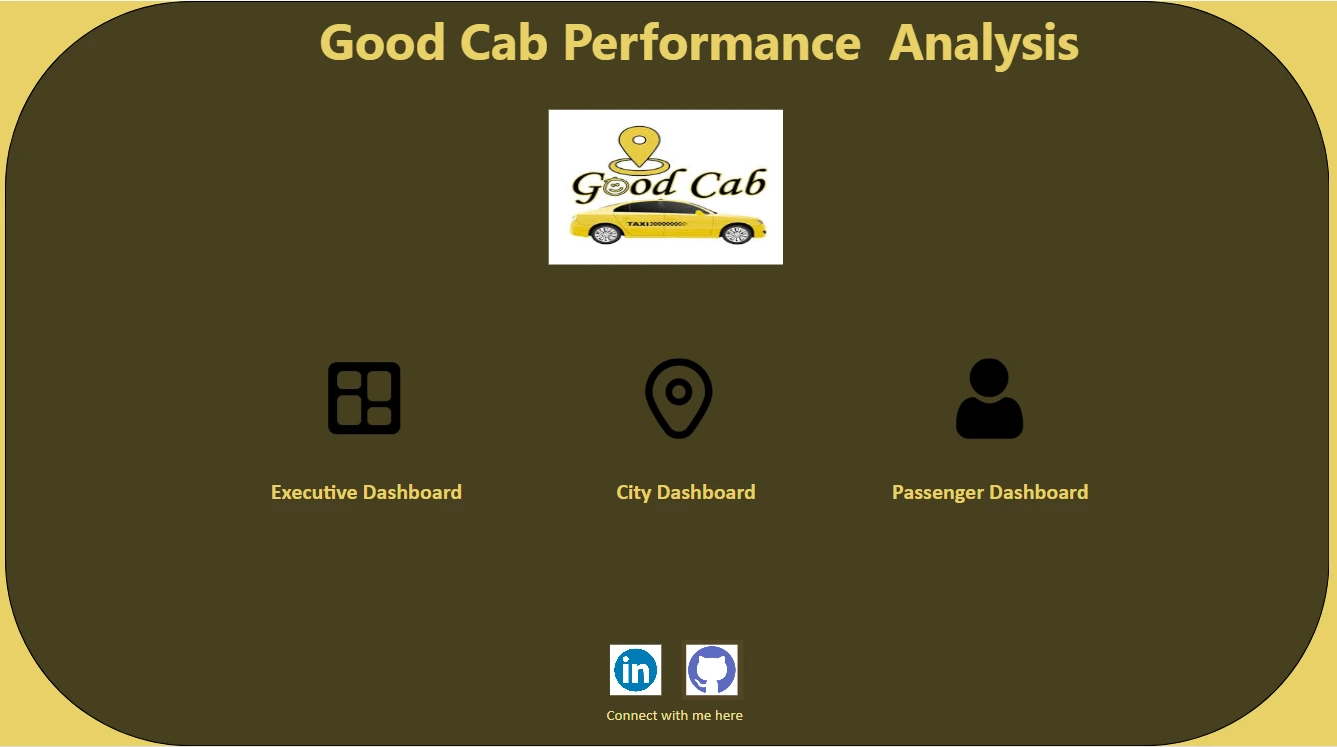
🚖 Good Cabs Performance Dashboard – Power BI Project
Date: May 2025
Role: Data Analyst
Technologies: Power BI, Power Query, DAX
Data Source: Good Cab Transportation CSV Data (May–Jun 2025)
Project Overview
Background
Good Cabs, a fast-growing urban mobility service provider, needed insights into its trip volume, passenger satisfaction, and city-level performance. As the Data Analyst on the team, I developed a comprehensive Power BI dashboard to help stakeholders monitor performance, identify underperforming regions, and improve customer retention.
Objective
To clean and model the data using Power Query, build KPIs using DAX, and visualize operational insights to help the business:
Understand trends in trips, revenue, and customer behavior
Identify cities with growth opportunities or concerns
Compare new vs repeat customer dynamics
Track performance against targets at city and company level
Key Metrics & Highlights
Total Trips: 426,000
Total Revenue: ₹108M
Passengers Served: 238K
New: 177K
Repeat: 61K
Average Ratings:
Passenger: 7.66 / 10
Driver: 7.83 / 10
Total Distance Travelled:
New: 3.7M KM
Repeat: 4.3M KM
Average Fare per KM:
New: ₹14.22
Repeat: ₹12.48
Top Cities (by Revenue): Jaipur, Kochi, Chandigarh
Bottom Cities: Mysore, Vadodara, Coimbatore
City & Passenger Insights
City Dashboard Highlights
Passenger Satisfaction:
New: 8.65 (higher than target)
Repeat: 6.96 (needs improvement)
Peak Months: February & March
Low Demand Month: June
Weekday vs Weekend Trips:
Weekday: 56%
Weekend: 44%
Repeat Trip Drop-off:
Only 1.2% reached 10+ trips
30% completed a 2nd trip
Passenger Dashboard Highlights
Highest Repeat Rate: Surat (42.63%)
Lowest Repeat Rate: Mysore (11.23%)
Performance Against Target:
Exceeded: Mysore, Jaipur, Coimbatore
Missed: Lucknow, Indore, Vadodara
Business Recommendations
Strengthen loyalty programs to retain new customers
Investigate reasons for low repeat satisfaction
Allocate marketing spend in underperforming cities
Launch seasonal campaigns to recover June's slump
Use Surat’s repeat strategy in other cities
Tools & Technologies
Power BI: Dashboard development & data storytelling
Power Query: Data transformation & cleanup
DAX: Custom metrics like Avg Fare/KM, Retention %, Target vs Actual
Business Impact
The Good Cabs dashboard empowered leadership to make data-driven operational and marketing decisions. It brought visibility into customer satisfaction, regional performance, and repeat behavior—enabling targeted interventions to boost trip volume and retention.
View the Dashboard
Created by ,
Vidyalaxmi Mallya
Data Analyst
Like this project
Posted Jun 11, 2025
Developed a Power BI dashboard for Good Cabs to monitor performance and improve customer retention.
Likes
0
Views
2
Timeline
May 1, 2025 - Ongoing