AtliQ Grands Hospitality Analysis Dashboard
vidya mallya
AtliQ Grands Hospitality Analysis Dashboard
Date: October 9, 2024
Role: Data Analyst, AtliQ Grands
Technologies: Power BI, Power Query, DAX, Data Cleaning, Data Visualization
Data Source: AtliQ Grands Historical Data
Project Overview
1. Background and Overview
AtliQ Grands, a chain of luxury/business hotels in India, has been losing market share and revenue due to competitive pressures and suboptimal decision-making. To address this, AtliQ Grands’ revenue management team hired a third-party data analytics service, where I, as a Data Analyst, was tasked with developing actionable insights to help regain market share. This dashboard presents key performance metrics using historical data, providing AtliQ’s management with the intelligence needed to make informed decisions.
Objective
2. Data Structure and Overview
The dataset provided included:
fact_aggregated_bookings and fact_bookings: Capturing booking details, revenue, occupancy, and customer feedback.
dim_hotels, dim_rooms, dim_dates: Enabling insights on properties, rooms, and time-based performance.
The dataset was processed using Power Query for data cleaning and DAX for custom calculations, allowing for a detailed analysis of booking trends, revenue generation, and customer experience across AtliQ Grands’ properties.
Key Features
3. Executive Summary
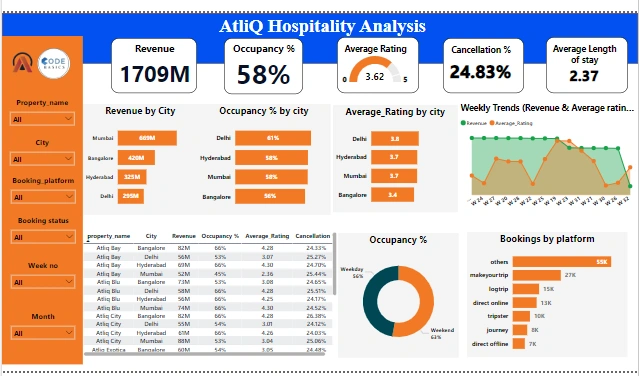
This dashboard was created to help AtliQ Grands’ leadership visualize key business metrics, including:
Revenue Trends: Providing visibility into how revenue has evolved over time.
Occupancy Rates: Tracking the percentage of rooms occupied across properties.
Cancellation Rates: Highlighting the frequency of cancellations.
Average length of stay: Identifying patterns in customer stays, helping with forecasting and pricing strategies.
Customer Satisfaction: Analyzing customer ratings from feedback received post-stay.
The dashboard features interactive slicers for filtering by property name, city, booking platform, booking status, week number, and month, offering a tailored view of performance across different dimensions.
Dashboard Components
4. Insights and Deep Dive
The insights generated from the dashboard highlight the following:
Revenue Trends: Revenue trends by cities
Occupancy Rates: Some properties exhibit consistently low occupancy, which correlates with higher cancellation rates.
Booking Platform Insights: Certain platforms have a higher share of cancellations, negatively impacting overall revenue.
Customer Ratings: Properties in major cities show higher customer satisfaction, while lower-rated properties are concentrated in Tier-2 cities.
5. Recommendations
Based on these findings, I recommend the following actions to improve performance and revenue for AtliQ Grands:
Focus on Underperforming Properties: Develop targeted marketing strategies for properties with low occupancy and high cancellation rates.
Partnership Optimization: Reevaluate booking platform partnerships that are contributing to higher cancellation rates.
Customer Experience Enhancement: Prioritize improvements at properties with lower customer satisfaction scores by addressing the feedback gathered from ratings.
Localized Promotions: Implement region-specific offers based on city-level performance data to boost occupancy and customer retention.
Technologies and Tools Used
Power BI for creating an interactive dashboard and visualizing key metrics.
Power Query for transforming and cleaning the raw data.
DAX (Data Analysis Expressions) to calculate metrics like revenue trends, occupancy rates, and customer Ratings.
Presented by Vidyalaxmi Mallya, Data Analyst.
Like this project
Posted Jun 11, 2025
Created a Power BI dashboard for AtliQ Grands to regain market share.
Likes
0
Views
2
Timeline
Sep 10, 2024 - Oct 9, 2024