Ecommerce Performance Dashboard – Power BI Project
vidya mallya
📊 Ecommerce Performance Dashboard – Power BI Project
Date: May 2025
Role: Freelance Data Analyst
Technologies: Power BI, Power Query, DAX
Data Source: Ecommerce Sales and Marketing Campaign Data (Jan–Apr 2025)
Project Overview
Background
A rapidly growing ecommerce brand specializing in regional snacks wanted to track and optimize its sales and digital marketing campaigns across multiple Indian states. I developed a comprehensive Ecommerce Dashboard in Power BI that provided real-time insights into product performance, ad efficiency, and customer behavior.
Objective
To integrate sales and marketing data, clean and structure it using Power Query, and calculate essential KPIs using DAX. The goal was to help the business:
Identify top-performing products and regions
Optimize advertising spends across platforms
Improve customer acquisition efficiency
Track campaign ROI and trends over time
Key Metrics & Features
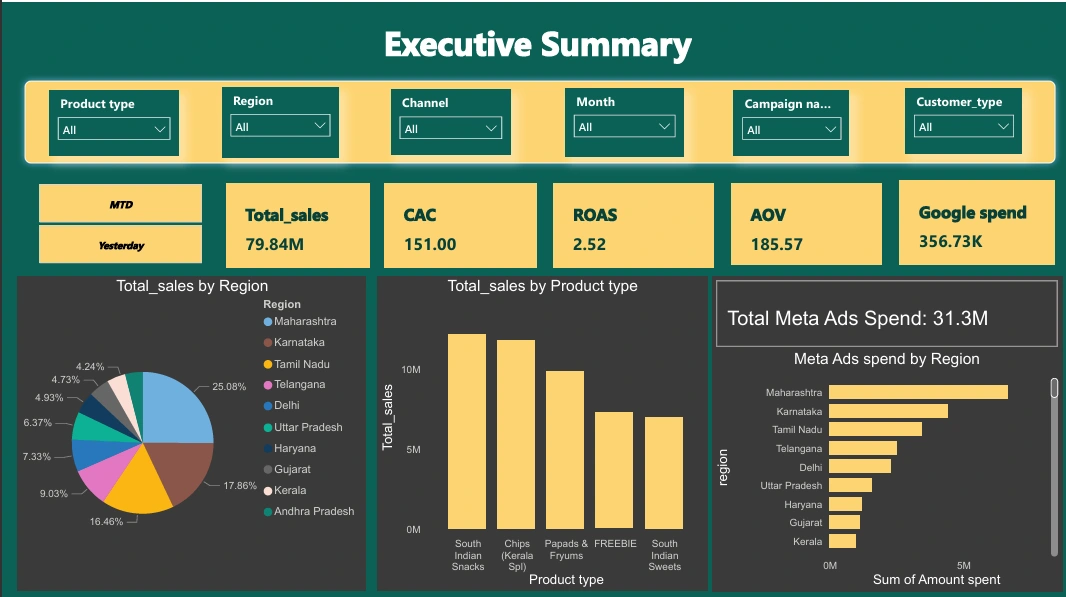
Total Sales: ₹79.84M
Google Ad Spend: ₹356.73K
Meta Ad Spend: ₹31.3M
CAC (Customer Acquisition Cost): ₹151
AOV (Average Order Value): ₹185.57
ROAS (Return on Ad Spend): 2.52 (average), up to 3.56 in campaigns
Impressions: 311M
Clicks: 4M+
Conversions: 129K
Regional & Product Insights
Top Sales Regions: Maharashtra, Karnataka, Tamil Nadu
High Revenue Product Types:
South Indian Snacks
Kerala Chips
Papads & Fryums
Campaign Performance Highlights
Top ROAS Campaigns:
“MT | Cart Abandon - Remarketing”
“MT | Existing Customers”
Campaign Metrics Tracked:
Daily Spend
ROAS by Campaign
Conversions Over Time
Clicks and CTR
Business Recommendations
Increase ad budget on high-ROAS campaigns
Improve CTR by testing better creatives
Scale product supply in high-demand states
Lower CAC by targeting repeat customers and optimizing Google spend
Monitor conversion-to-spend ratio monthly
Tools & Technologies
Power BI: Data visualization and dashboard creation
Power Query: Data transformation and cleaning
DAX: Custom KPIs like ROAS, CAC, AOV, Conversion Rate
Business Impact
This dashboard empowered the ecommerce team to make data-driven decisions across marketing, inventory, and regional expansion — driving higher ROI, better targeting, and smarter product focus.
Download or View Dashboard
Created by Vidyalaxmi Mallya, Freelance Data Analyst
Like this project
Posted Jun 11, 2025
Developed a Power BI dashboard for an ecommerce brand to optimize sales and marketing.
Likes
0
Views
0
Timeline
Apr 1, 2025 - May 31, 2025