The network for creativity
Join 1.25M professional creatives like you
Connect with clients, get discovered, and run your business 100% commission-free
Creatives on Contra have earned over $150M and we are just getting started
Back to feedPost

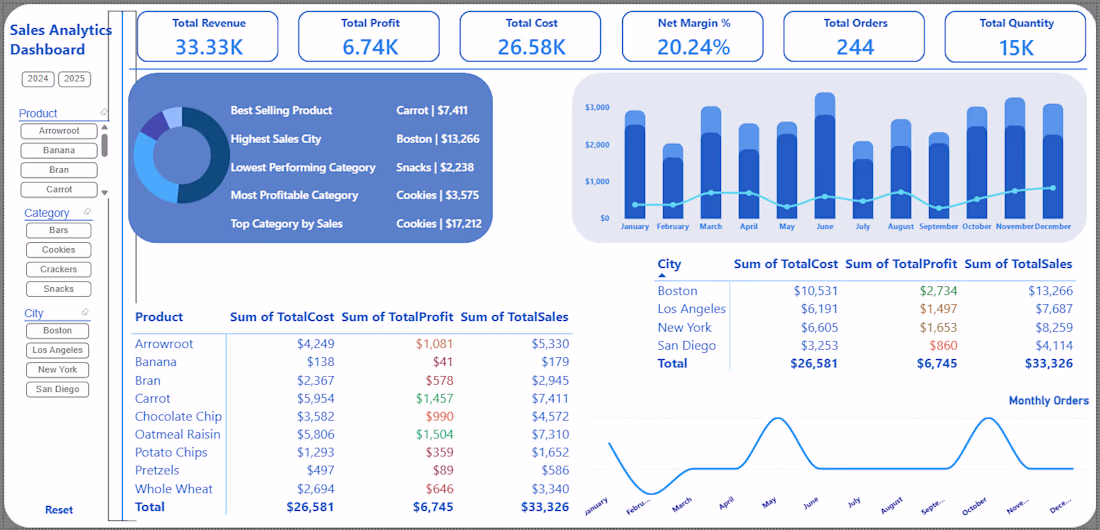
Sales Analytics Dashboard (Power BI)
Interactive sales analytics dashboard built in Microsoft Power BI to monitor revenue performance, profitability, and product trends.
Key insights included:
• Total revenue, profit, cost, and margin KPI tracking
• Monthly sales performance and trend analysis
• Best-selling products and most profitable categories
• Sales performance by city
• Interactive filtering by product, category, and location
This dashboard enables businesses to quickly identify top products, evaluate profitability, and monitor sales trends across regions.
Tools used: Microsoft Power BI, data modeling, and data visualization.


The network for creativity
Join 1.25M professional creatives like you
Connect with clients, get discovered, and run your business 100% commission-free
Creatives on Contra have earned over $150M and we are just getting started
Related posts

The Sales Segment Performance Dashboard provides a comprehensive view of sales distribution, operating costs, and customer segment performance across different regions. Designed using Power BI, this dashboard helps organizations analyze sales trends, identify high-performing markets, and monitor operational costs for better strategic planning.
Key KPIs Tracked
✔ Consumer Sales – Total revenue generated from individual customers
✔ Corporate Sales – Sales performance from corporate clients
✔ Home Office Sales – Revenue generated from home office segment
✔ Small Business Sales – Sales contribution from small businesses
Data AnalysisData VisualizationdashboardpowerbidashboarduiMicrosoft Power BIUI DesignFigmaMicrosoft Excel


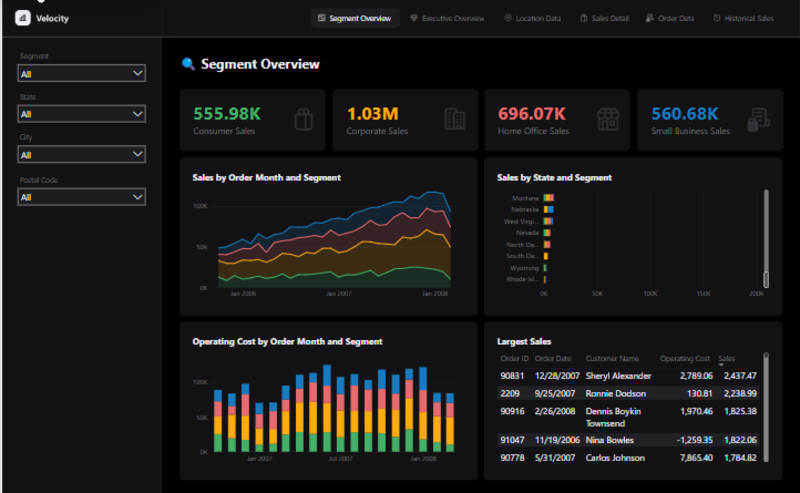

Breaking down performance by consumer, corporate, home office and small business segments in one view gives leadership exactly the clarity they need for strategic planning. Clean layout!

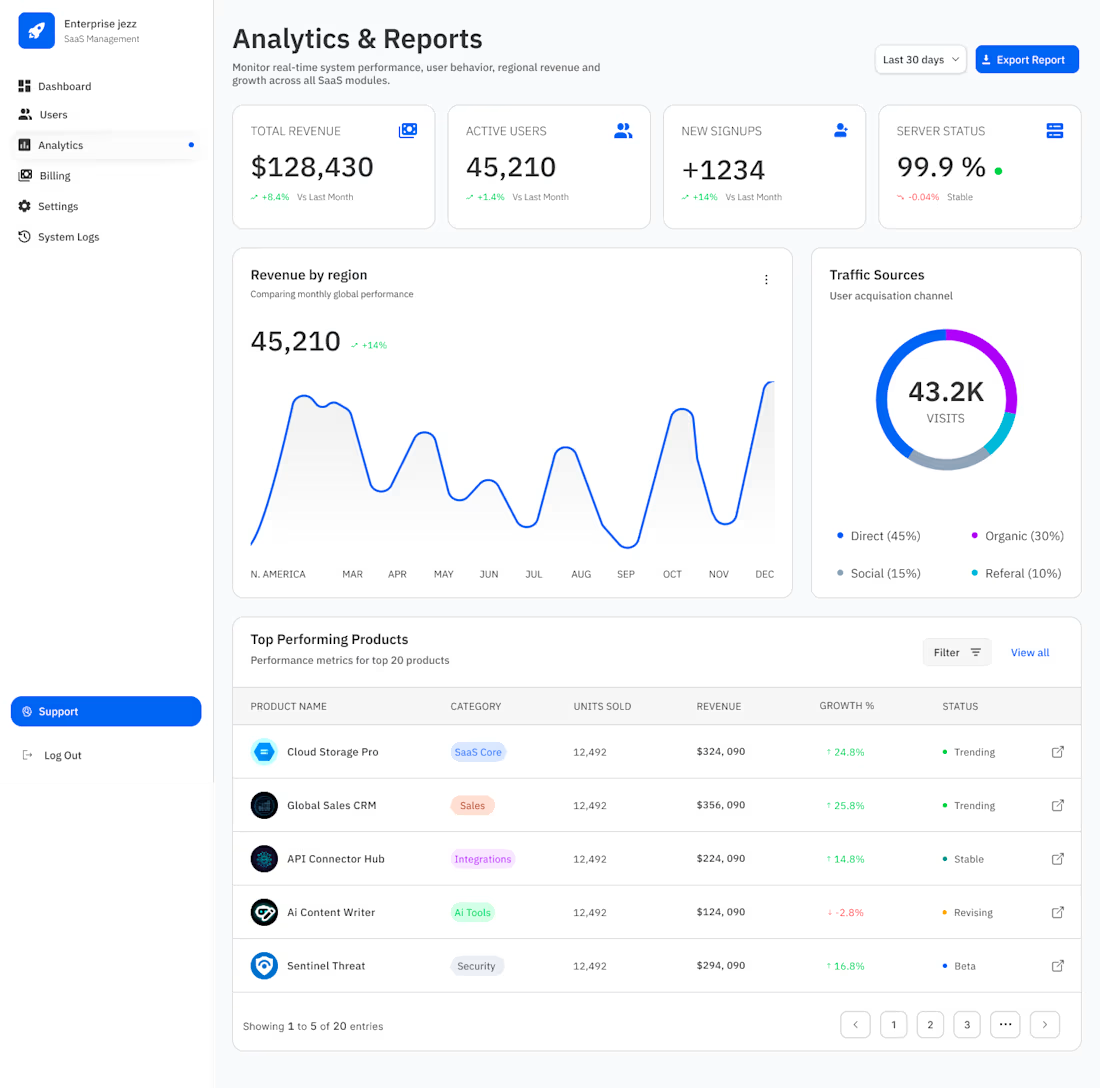
From "Data Dump" to "Decision Engine."
If the dashboard is the heartbeat, the Analytics page is the brain. For Enterprise Jezz, I didn’t want users hunting for insights—I wanted the insights to find them.
When designing for scale, "more charts" isn't the answer. Visual hierarchy is.
For this view, I prioritized:
♣︎. The 4-Pillar Pulse: High-level KPIs (Revenue, Users, Signups, Server Status) at the top for an "at-a-glance" health check.
♣︎. Dual-Axis Storytelling: Combining a high-density Revenue line graph with a Traffic Source donut to show not just what happened, but where it came from.
♣︎. Status-First Tables: Using semantic "Trending," "Stable," and "Beta" tags so product managers can spot outliers in seconds, not minutes.
99.9% Server Status is great, but 100% clarity for the user is the goal. :)
#BuildInPublic #SaaS

Clean and simple

QuotaSight is a B2B SaaS platform that helps sales teams understand pipeline performance and revenue. The Sales Performance Dashboard consolidates key insights into one clear view with KPI cards, a sales funnel, revenue trends, and rep performance data, allowing leaders to quickly see pipeline health, identify bottlenecks, and track team performance.
📩 Collaborate with Us? Contra Cansaas Agency


Trending
aivideo
AI video tools are moving at warp speed. Which ones are you experimenting with?
returntonature
Spring is a reset for creativity. What’s inspiring you outside the screen right now?
aidesignflow
AI tools are redefining design work. What's your current workflow?
freelancerlife
Freelancer life is wins, pivots, and everything in between. What’s yours right now?
allthingsmetal
Metal is having a design moment – from chrome to gates and grates. What designs are you forging?