The network for creativity
Join 1.25M professional creatives like you
Connect with clients, get discovered, and run your business 100% commission-free
Creatives on Contra have earned over $150M and we are just getting started
Back to feedPost

Developed a Retail Sales Dashboard to analyze key business metrics such as total sales, profit, quantity sold, and number of orders. The dashboard includes interactive filters for date, region, product category, and payment mode, helping users track sales trends and identify top-performing products for better decision-making.


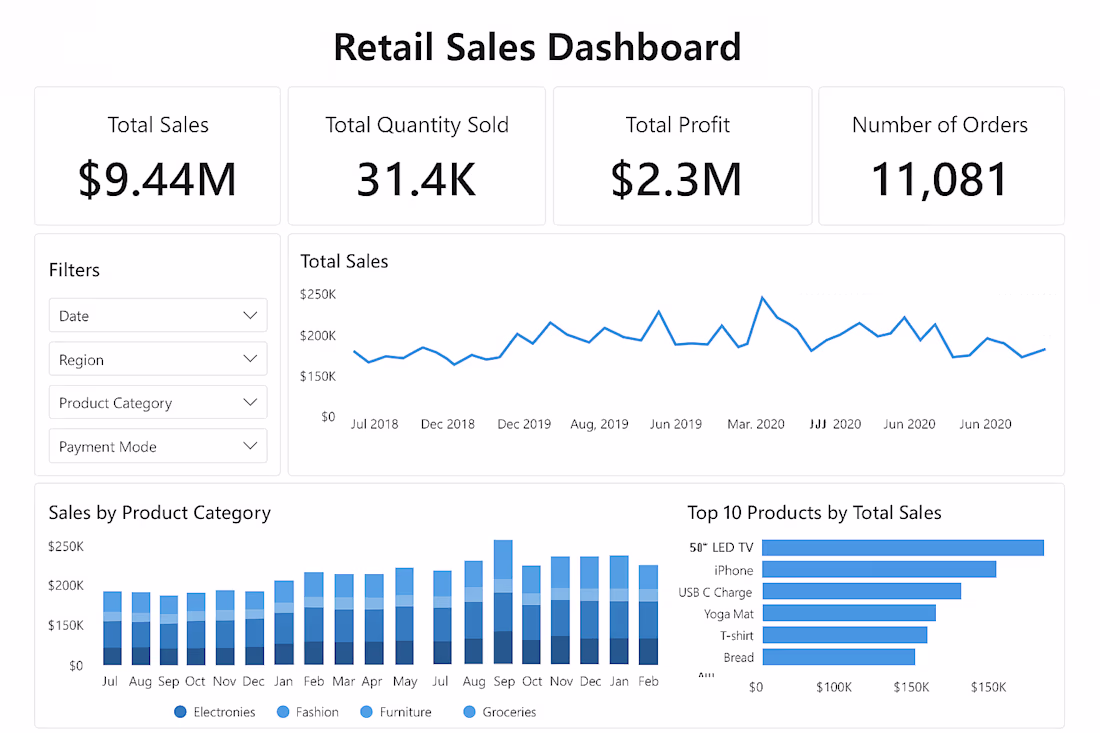

Four filters together — date, region, product category and payment mode — gives a really complete picture without overwhelming the layout. The Top 10 Products bar chart alongside category breakdown is a smart pairing. Was this built in Power BI or Excel?
The network for creativity
Join 1.25M professional creatives like you
Connect with clients, get discovered, and run your business 100% commission-free
Creatives on Contra have earned over $150M and we are just getting started
Related posts

Superstore Sales Dashboard & Forecasting🙌
• Developed interactive dashboard analyzing 10,000+ transactions to track revenue and profit metrics.
• Performed trend analysis and 15-day forecasting, reducing manual reporting effort by 40%.
• Provided insights to improve inventory planning and sales monitoring.
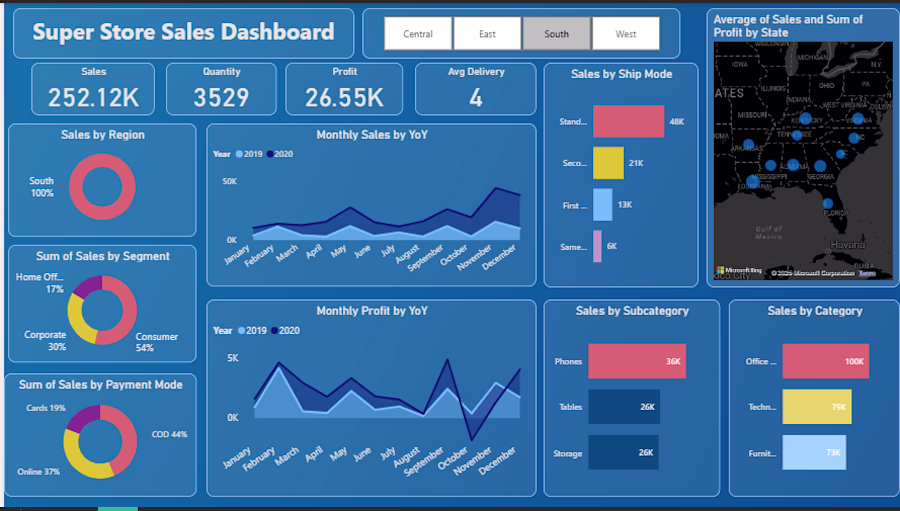
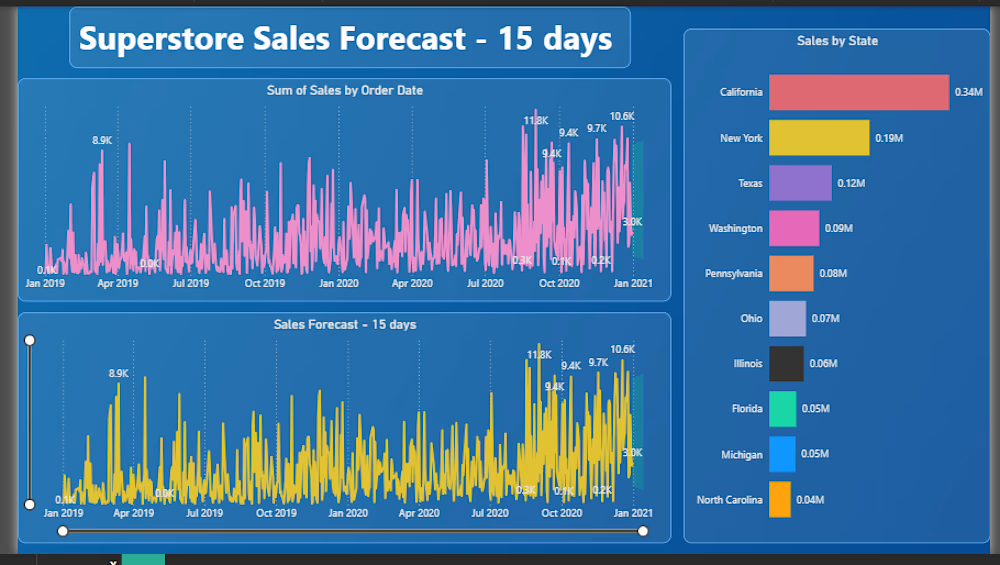
Adding a 15-day forecast alongside the sales dashboard is a smart move — most dashboards only show what happened, not what's coming. The YoY monthly comparison view gives really clear context too. Did you build the forecasting model using Power BI's built-in analytics or a custom formula approach?
Why Excel still beats expensive software for small businesses
Most small business owners I talk to feel like they should be using some fancy CRM or ERP system.
But here's the truth nobody tells you:
For businesses under 50 people, Excel done right beats expensive software almost every time.
Here's why 👇
1. You already have it
No subscription. No onboarding. No monthly fees. Excel is sitting right there.
2. It bends to your business
Software forces you into its structure. Excel fits around your workflow — your terms, your columns, your logic.
3. Your team already knows it
No training required. Everyone from the accountant to the sales person can open and read a well-built Excel file.
4. One clean file beats 3 scattered tools
I've seen businesses track leads in WhatsApp, revenue in a notebook and expenses in their head. One organized Excel dashboard brings it all together.
The problem was never Excel.
The problem was never having it set up properly.
What tool does your business currently use to track data?


Excellent insights!

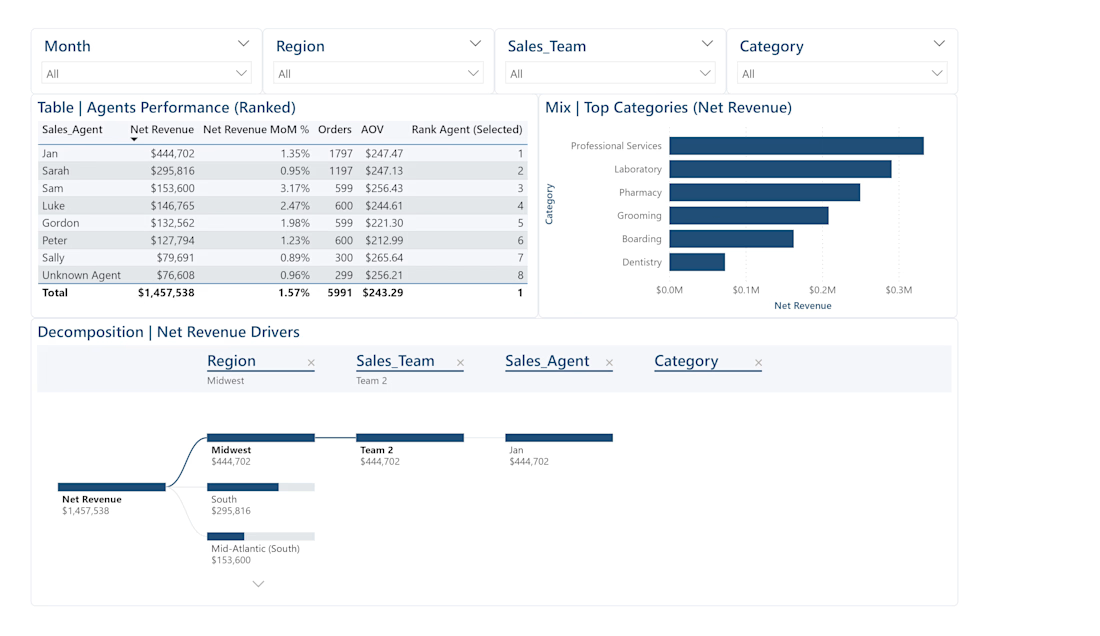
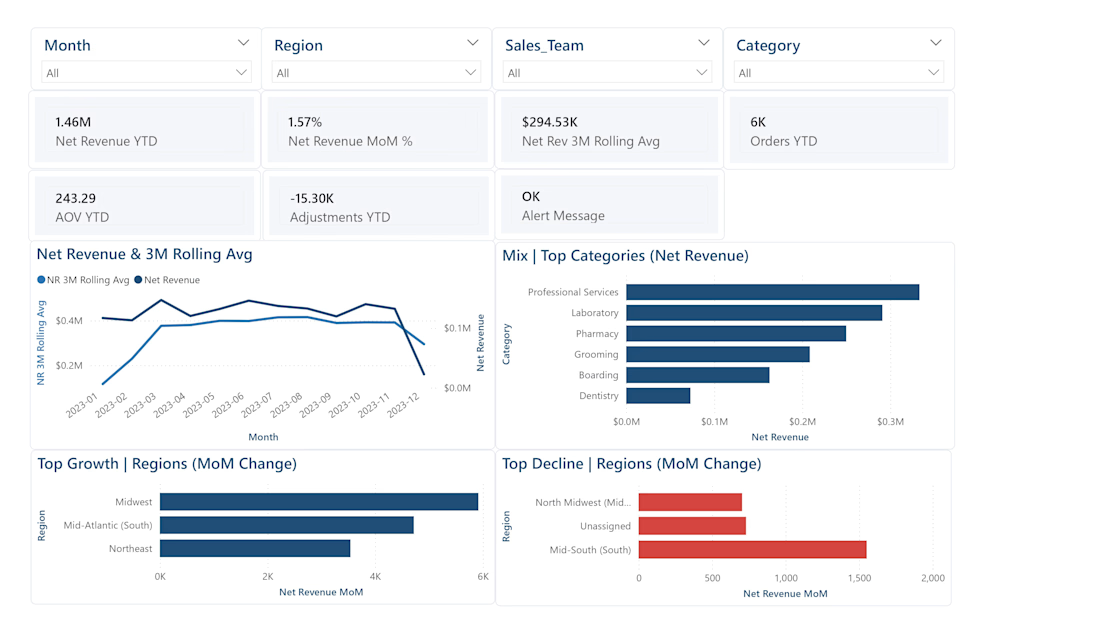
📊 Sales Performance Analytics Dashboard (Power BI)
This Power BI dashboard was developed as part of a technical case study to demonstrate a business‑first approach to performance analytics.
The report is designed to support both executive‑level decision‑making and operational sales management by focusing on:
Revenue performance tracking
Key performance drivers (Orders & Average Order Value)
Team‑level performance monitoring
Individual agent insights
Data quality validation and exception handling
🔎 Key Functional Areas
Executive Overview
Provides a high‑level summary of Net Revenue and its primary drivers, supported by a monthly trend and rolling average to identify emerging performance patterns and reduce short‑term volatility.
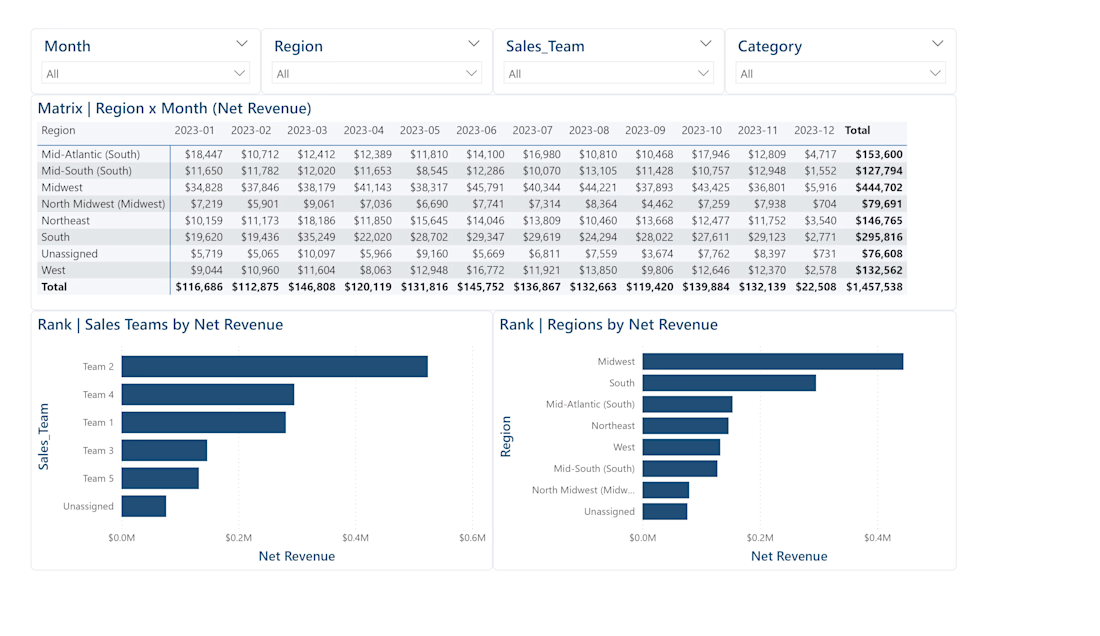
Performance Diagnostics (Region × Time)
Enables root‑cause analysis by highlighting when and where performance changes occurred across regions and time periods.
Sales Team Monitoring
Supports day‑to‑day management through ranked team performance metrics, enabling prioritization of coaching or follow‑up actions.
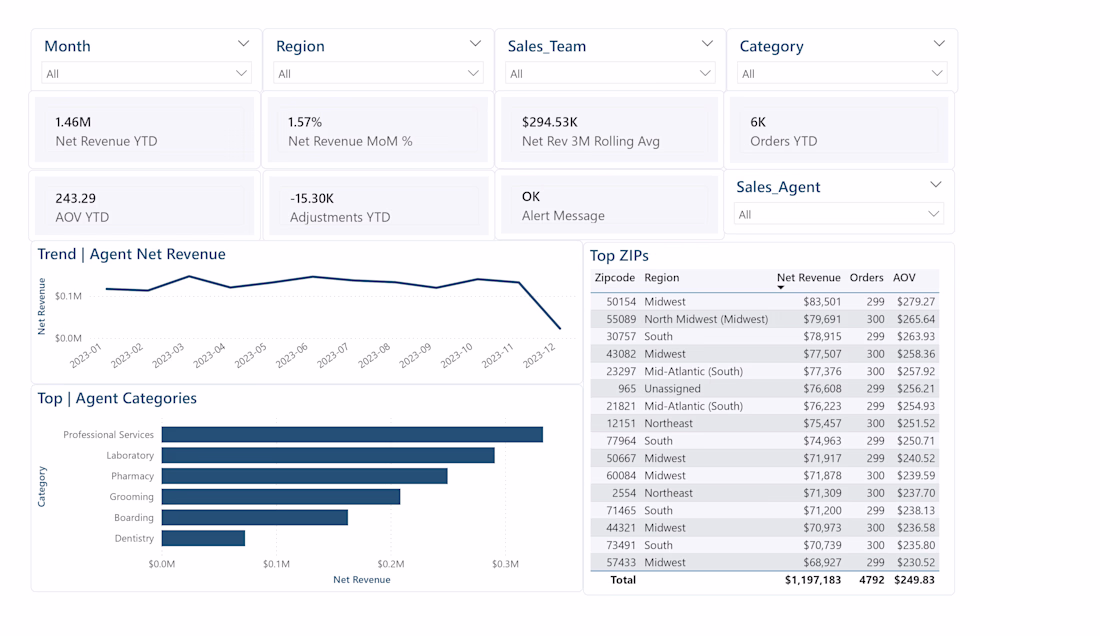
Agent‑Level Analysis
Offers a focused performance view per individual contributor, including category mix and territory‑level revenue drivers.
Data Quality Monitoring
Separates adjustments (e.g. returns, discounts) from gross performance to prevent misleading KPI interpretation.
💼 Business Value
Designed to:
Monitor operational performance
Identify revenue drivers behind month‑over‑month changes
Detect under‑ or over‑performing teams
Support targeted coaching
Enable fast, data‑driven decision‑making
🛠 Tools & Concepts Used
Power BI
Data Modeling (Fact / Dimension)
KPI Design
MoM Analysis
Driver‑Based Revenue Monitoring
AOV Tracking
Data Quality Checks


Great job


Trending


FLORA
Reusable workflows are replacing one-off prompts in creative AI. Share what you're building in FLORA.
portfolioreview
The best portfolios tell a story, not just show a grid. Share yours for feedback.
brandguidelines
Brand guidelines are becoming living systems. What are you building for your clients?
freelancerlife
Freelancer life is wins, pivots, and everything in between. What’s yours right now?
aivideo
AI video tools are moving at warp speed. Which ones are you experimenting with?