
Stefan Automation
Automation & Data Analytics | SQL | Power BI | Excel | R
New to Contra
Stefan is ready for their next project!
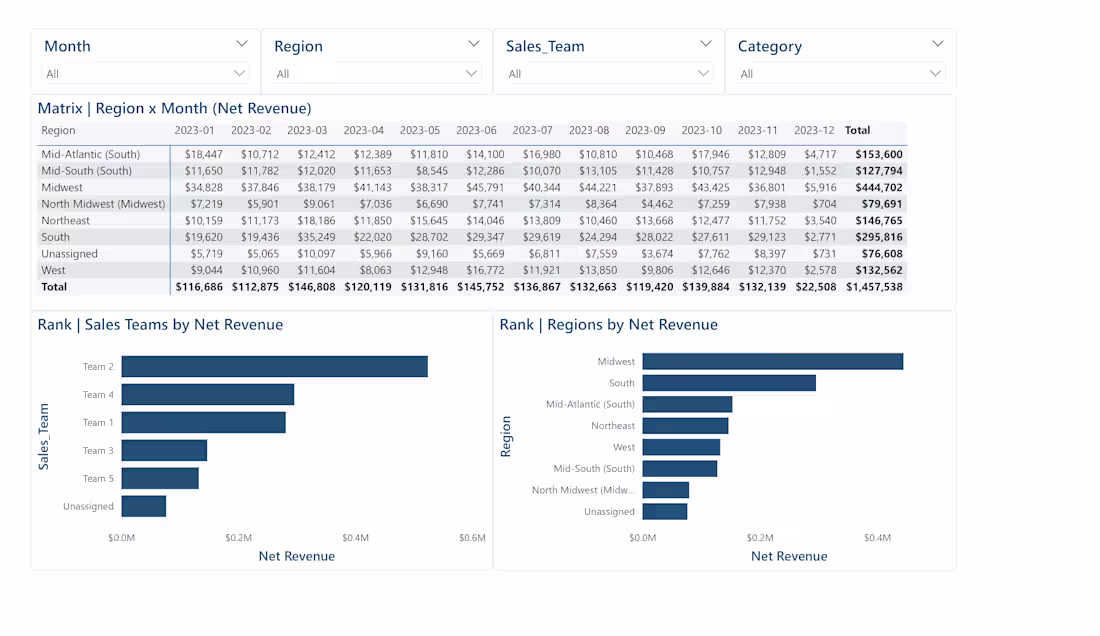
📊 Sales Performance Analytics Dashboard (Power BI)
This Power BI dashboard was developed as part of a technical case study to demonstrate a business‑first approach to performance analytics.
The report is designed to support both executive‑level decision‑making and operational sales management by focusing on:
Revenue performance tracking
Key performance drivers (Orders & Average Order Value)
Team‑level performance monitoring
Individual agent insights
Data quality validation and exception handling
🔎 Key Functional Areas
Executive Overview
Provides a high‑level summary of Net Revenue and its primary drivers, supported by a monthly trend and rolling average to identify emerging performance patterns and reduce short‑term volatility.
Performance Diagnostics (Region × Time)
Enables root‑cause analysis by highlighting when and where performance changes occurred across regions and time periods.
Sales Team Monitoring
Supports day‑to‑day management through ranked team performance metrics, enabling prioritization of coaching or follow‑up actions.
Agent‑Level Analysis
Offers a focused performance view per individual contributor, including category mix and territory‑level revenue drivers.
Data Quality Monitoring
Separates adjustments (e.g. returns, discounts) from gross performance to prevent misleading KPI interpretation.
💼 Business Value
Designed to:
Monitor operational performance
Identify revenue drivers behind month‑over‑month changes
Detect under‑ or over‑performing teams
Support targeted coaching
Enable fast, data‑driven decision‑making
🛠 Tools & Concepts Used
Power BI
Data Modeling (Fact / Dimension)
KPI Design
MoM Analysis
Driver‑Based Revenue Monitoring
AOV Tracking
Data Quality Checks
2
2
161
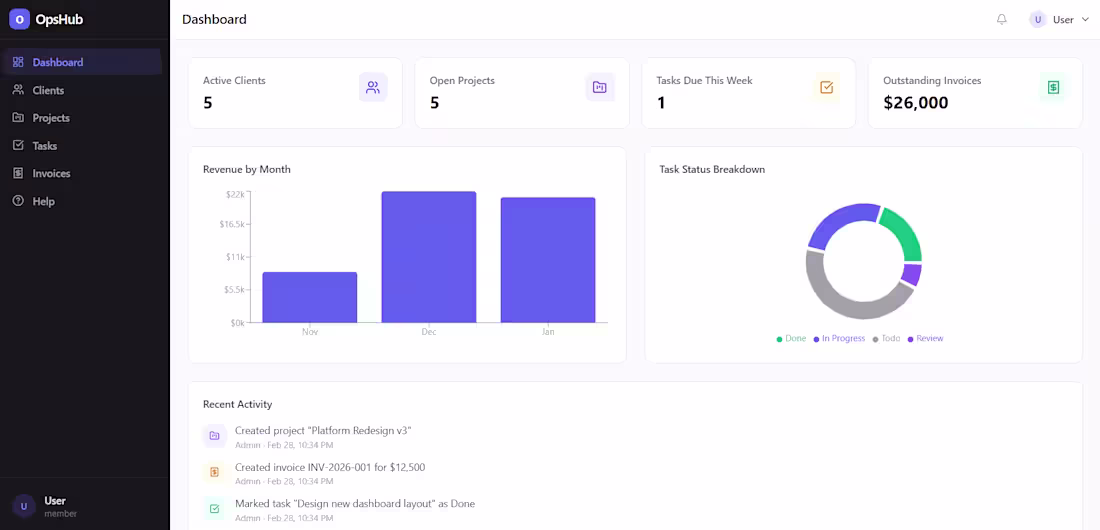
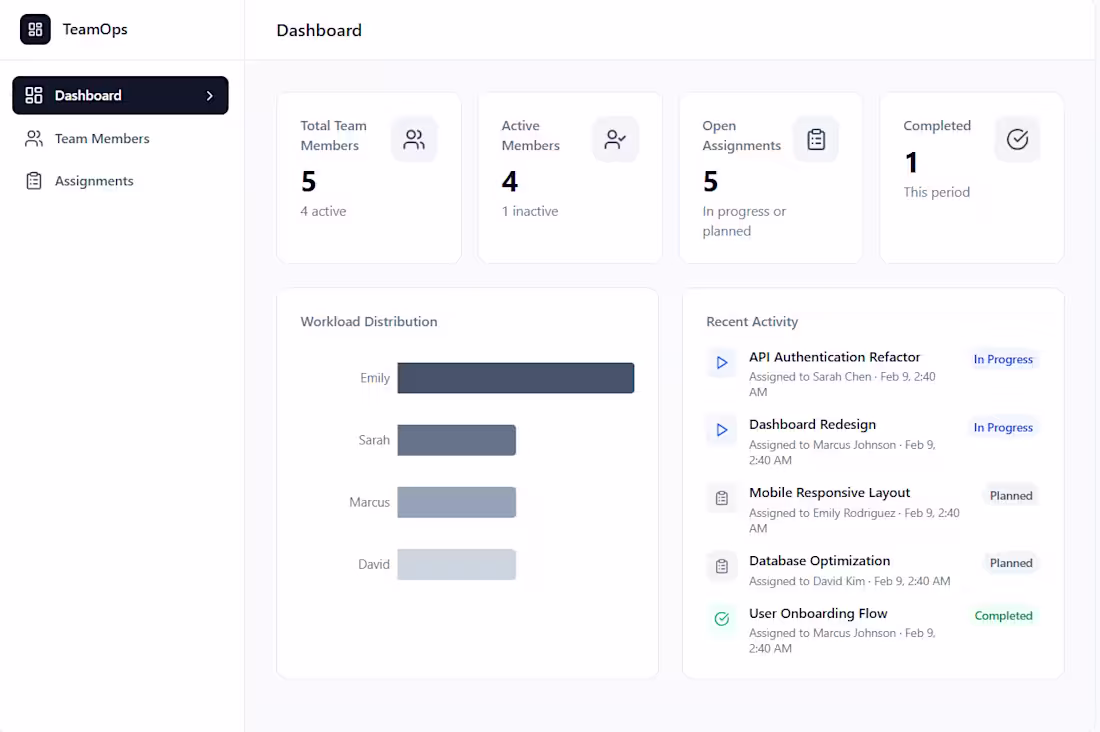
OpsHub – Internal Operations System
A custom internal tool built to centralize client management, project tracking, task workflows, and invoicing in one clean dashboard.
It replaces spreadsheets and manual coordination with a structured, role-based system that improves operational visibility and financial tracking.
Ideal for small teams that need clarity, control, and scalable internal workflows.
2
4
261
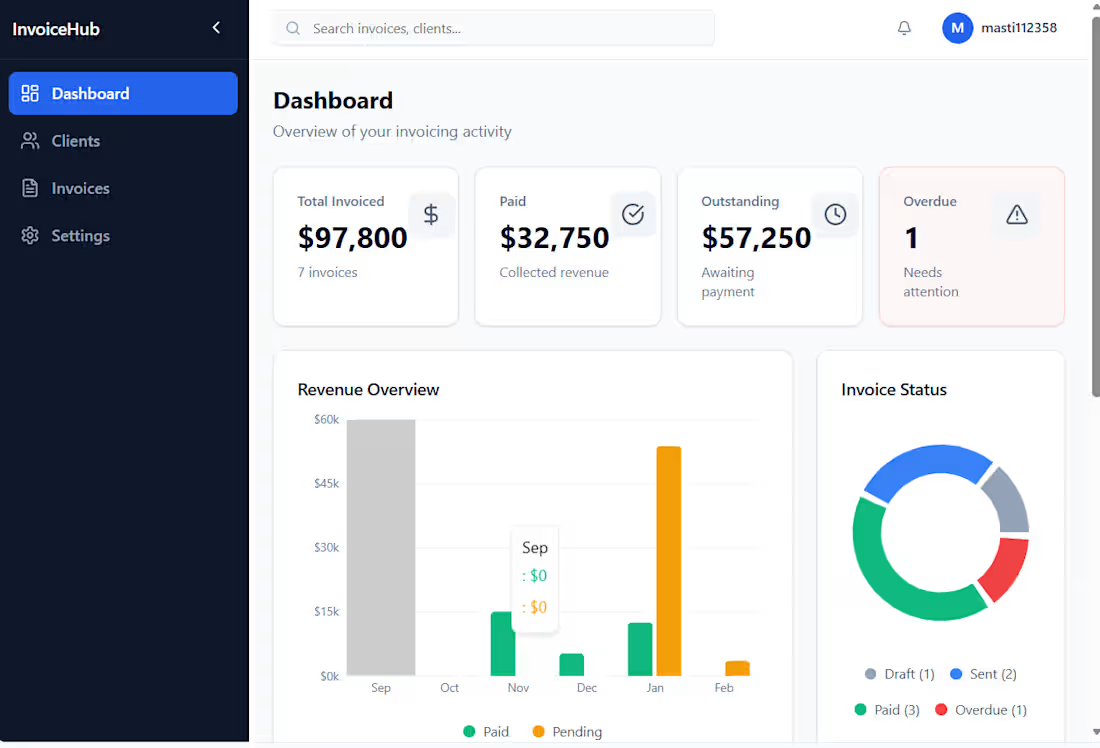
Internal invoicing and billing web application for tracking invoices, payment status, and basic revenue records, with CRUD workflows and a clear operational dashboard.
0
291
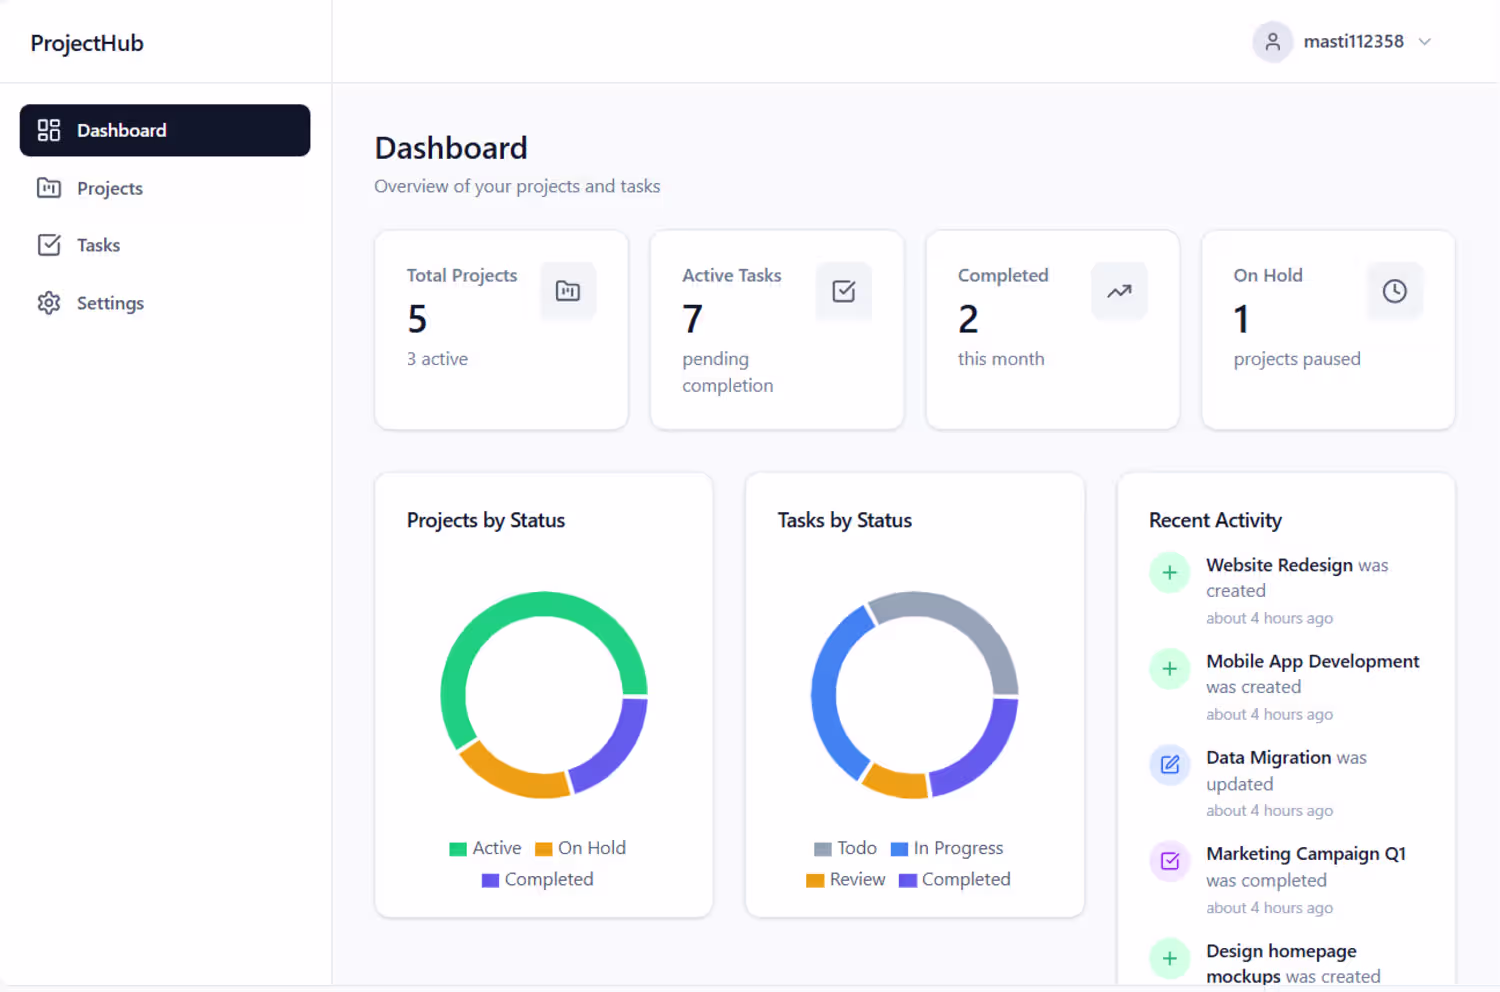
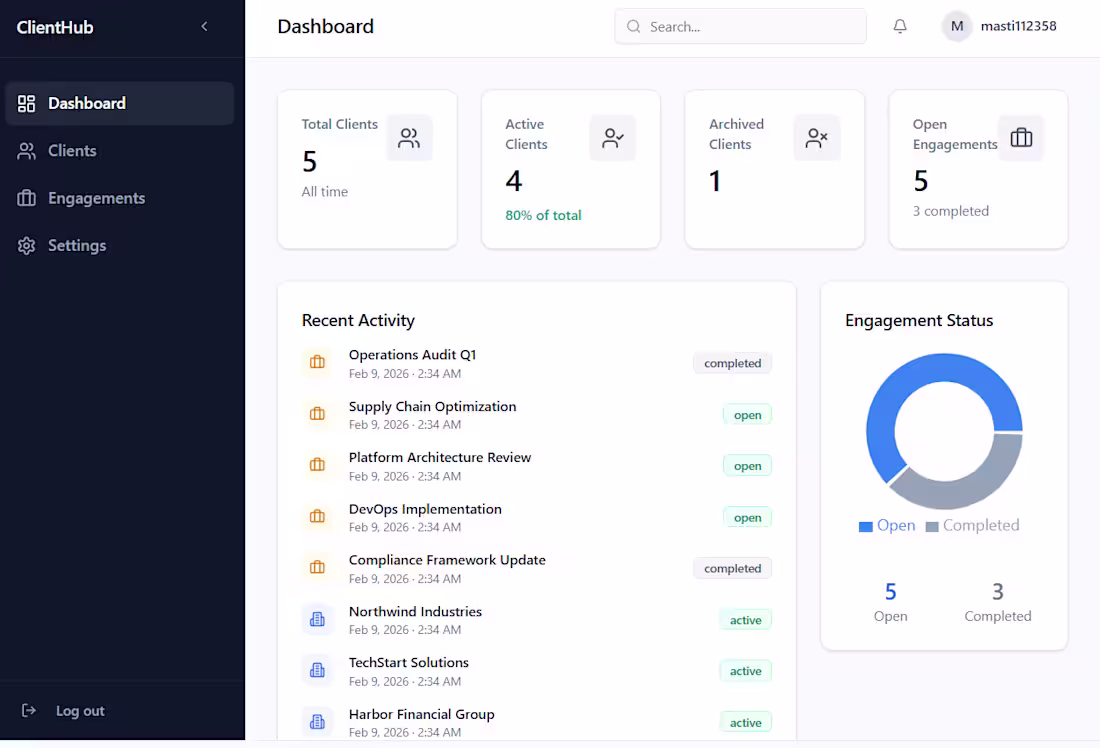
A production‑ready internal web application designed to help small teams manage clients and their ongoing work in a structured and maintainable way.
The application provides authentication, full CRUD functionality for client records, engagement tracking per client, and detailed views with notes and status history. Clients can be archived instead of deleted to preserve operational data.
An overview dashboard presents key operational metrics, including total and active clients, open versus completed engagements, and recent activity, using simple summary cards and basic visualizations.
Built with React and TypeScript on the frontend and a Node.js / Express backend, the project focuses on clean architecture, realistic CRUD logic, and MVP‑level internal tooling.
2
6
385
Internal client management web application for managing clients and their ongoing engagements.
Includes authentication, full CRUD functionality, engagement tracking, and a clean dashboard overview, designed as a realistic internal tool for small teams.
0
247

A production‑ready web application demonstrating real‑world CRUD functionality and internal dashboards commonly used by small teams and startups.
Includes email/password authentication, a full CRUD system with sorting and filtering, detailed item views, and an overview dashboard with status breakdowns and recent activity. Admin features allow archiving records and basic role-based access.
Built with React and TypeScript on the frontend and a Node.js / Express API, with a clean, maintainable codebase and a neutral, professional UI designed as an internal tool rather than a marketing site.
0
249