The network for creativity
Join 1.25M professional creatives like you
Connect with clients, get discovered, and run your business 100% commission-free
Creatives on Contra have earned over $150M and we are just getting started
Back to feedPost
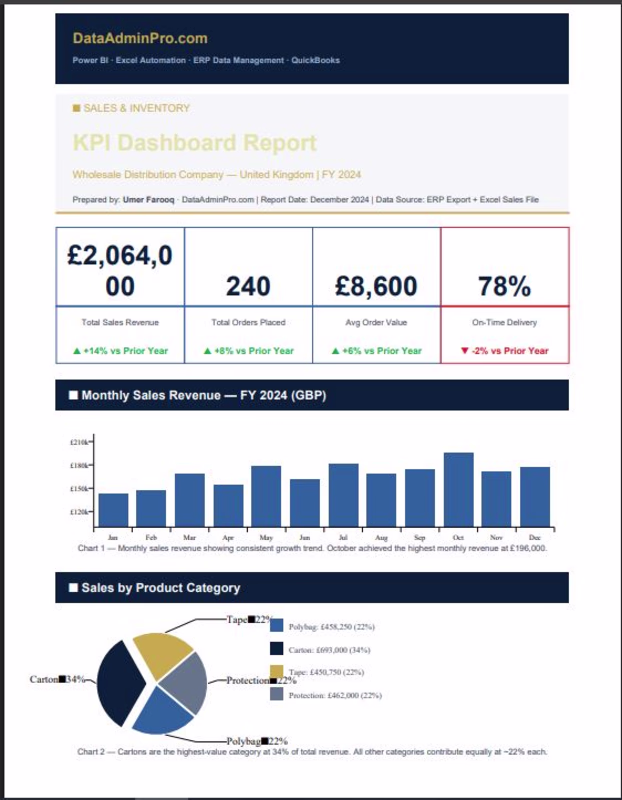
📊 Sales Performance Analytics Dashboard (Power BI)
This Power BI dashboard was developed as part of a technical case study to demonstrate a business‑first approach to performance analytics.
The report is designed to support both executive‑level decision‑making and operational sales management by focusing on:
Revenue performance tracking
Key performance drivers (Orders & Average Order Value)
Team‑level performance monitoring
Individual agent insights
Data quality validation and exception handling
🔎 Key Functional Areas
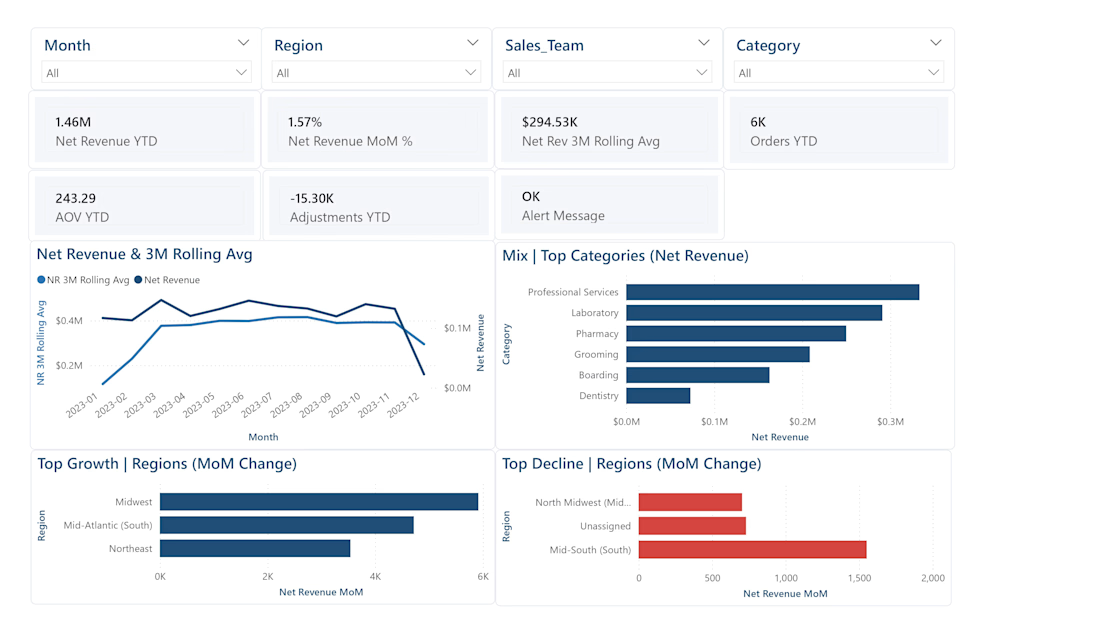
Executive Overview
Provides a high‑level summary of Net Revenue and its primary drivers, supported by a monthly trend and rolling average to identify emerging performance patterns and reduce short‑term volatility.
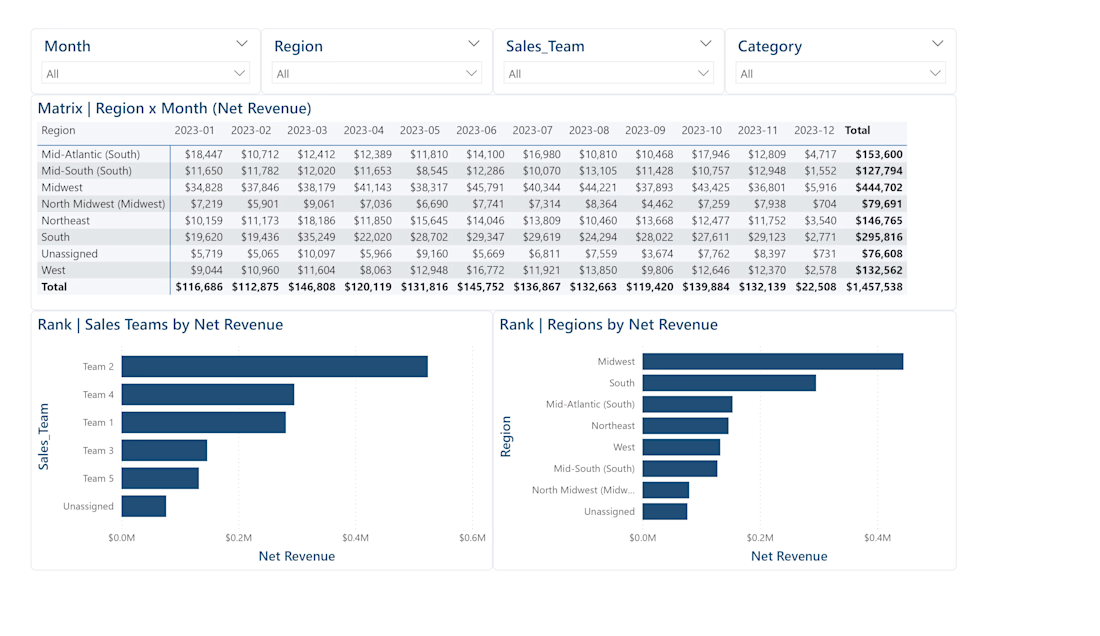
Performance Diagnostics (Region × Time)
Enables root‑cause analysis by highlighting when and where performance changes occurred across regions and time periods.
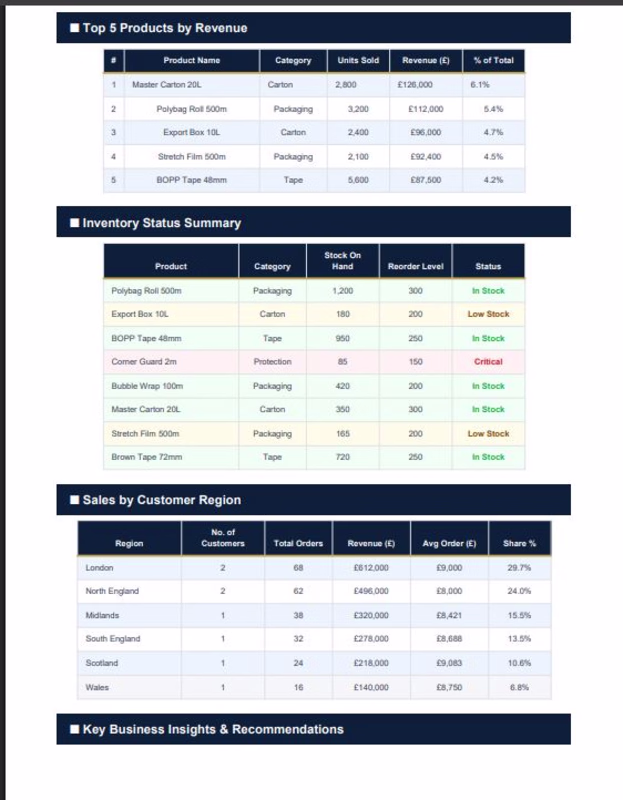
Sales Team Monitoring
Supports day‑to‑day management through ranked team performance metrics, enabling prioritization of coaching or follow‑up actions.
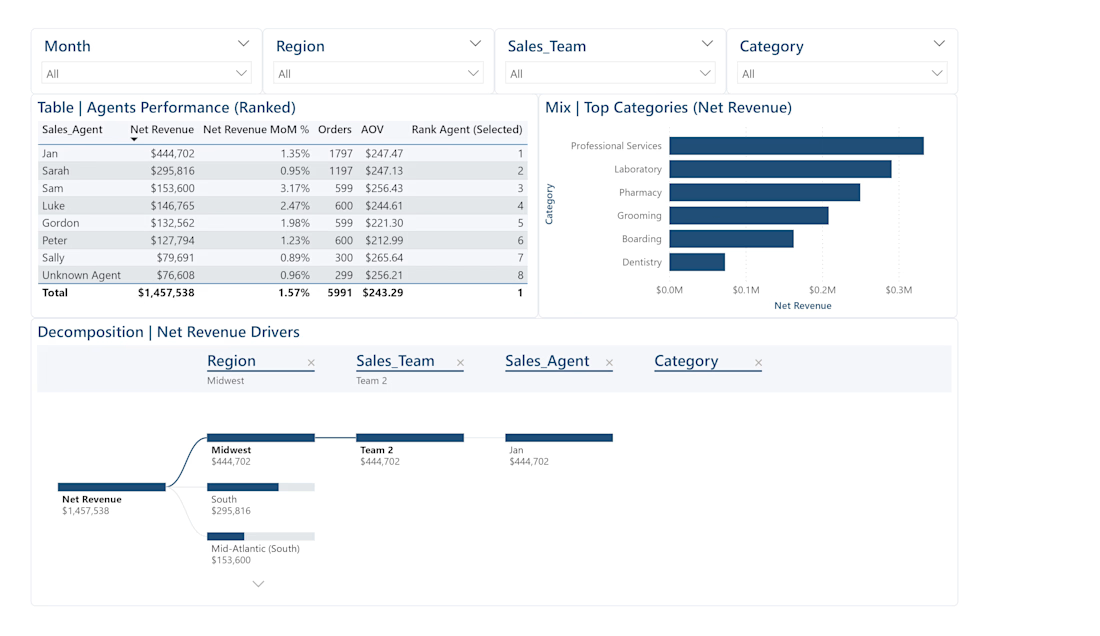
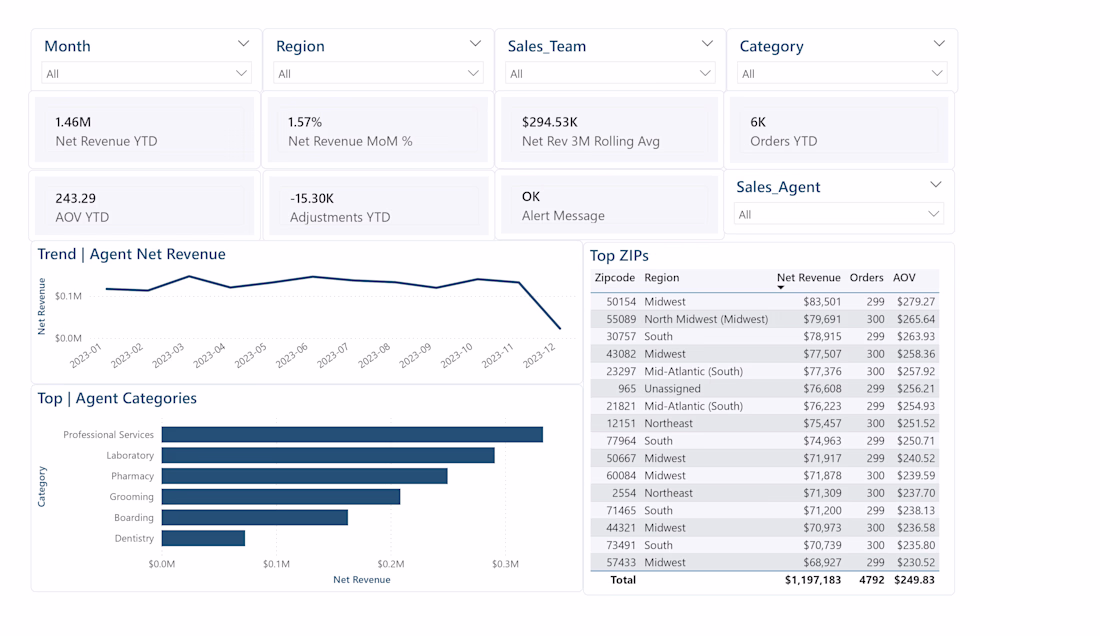
Agent‑Level Analysis
Offers a focused performance view per individual contributor, including category mix and territory‑level revenue drivers.
Data Quality Monitoring
Separates adjustments (e.g. returns, discounts) from gross performance to prevent misleading KPI interpretation.
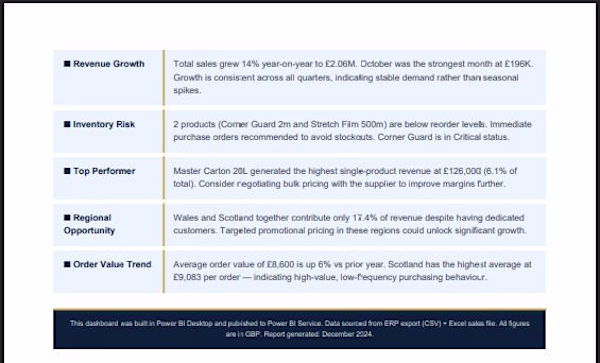
💼 Business Value
Designed to:
Monitor operational performance
Identify revenue drivers behind month‑over‑month changes
Detect under‑ or over‑performing teams
Support targeted coaching
Enable fast, data‑driven decision‑making
🛠 Tools & Concepts Used
Power BI
Data Modeling (Fact / Dimension)
KPI Design
MoM Analysis
Driver‑Based Revenue Monitoring
AOV Tracking
Data Quality Checks
Great job
Thanks! Built this with a focus on surfacing revenue drivers clearly for faster decision-making.
The network for creativity
Join 1.25M professional creatives like you
Connect with clients, get discovered, and run your business 100% commission-free
Creatives on Contra have earned over $150M and we are just getting started
Related posts
AI ads don't have to suck! what do you think of these two?
The process here was:
Creative strategist = concept x brief
Visual Asset manager = produce necessary screen recordings
Video editors = create AI scenes needed x edit together with recordings
4 voted
80%
1 voted
20%
5 votes
Closed
Adding the cat was genius, makes it seem way more natural. What generators are you using? Some of the most realistic looking people I've seen. 😅
Created a Meta ad concept for SalesDash focused on visualizing the shift from spreadsheet-based reporting to real-time sales performance management.
The design uses layered dashboard components, strong hierarchy, and a clear before-and-after narrative to highlight how SalesDash helps teams spend less time tracking data and more time driving results.
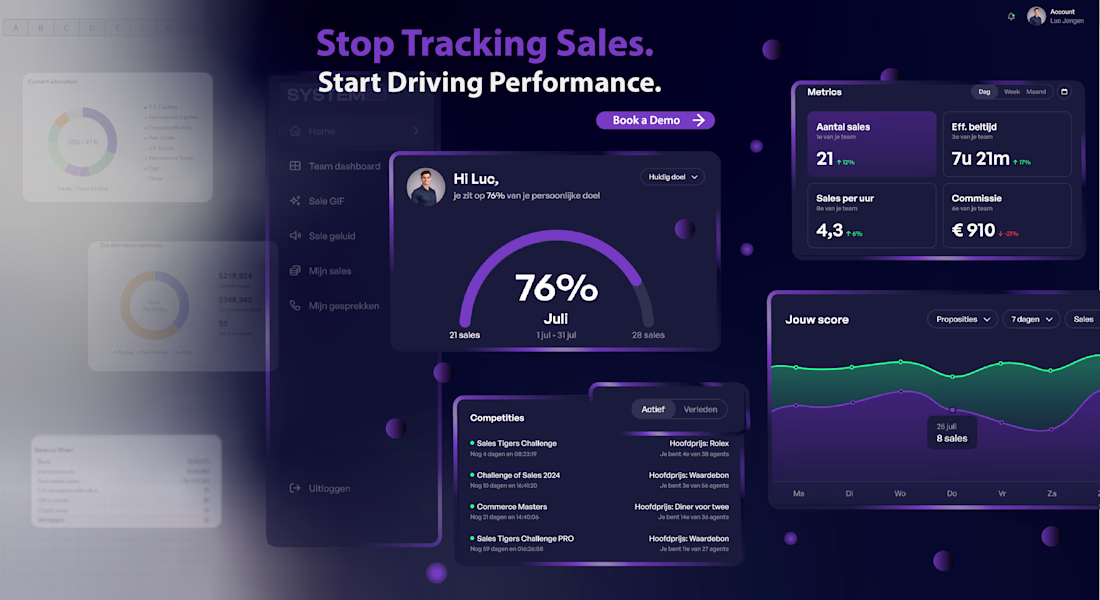
Monthly reporting cut from 5 hours to under 10 minutes
3 slow-moving product lines found — overstock reduced by 22%
Dashboard refreshes daily from source files — zero
Trending
Claude
Claude has entered the design space. How are you using Claude Design?
Contra University
Learn from expert creatives how to earn more using next-gen AI tools.
creativeaiflow
Creative AI workflows are evolving. What tools do you use, and what are their strengths and weaknesses?
portfolioreview
The best portfolios tell a story, not just show a grid. Share yours for feedback.
freelancerlife
Freelancer life is wins, pivots, and everything in between. What’s yours right now?