
Ankita Banubakode
"Data-focused analyst with strong QA experience."
New to Contra
Ankita is ready for their next project!
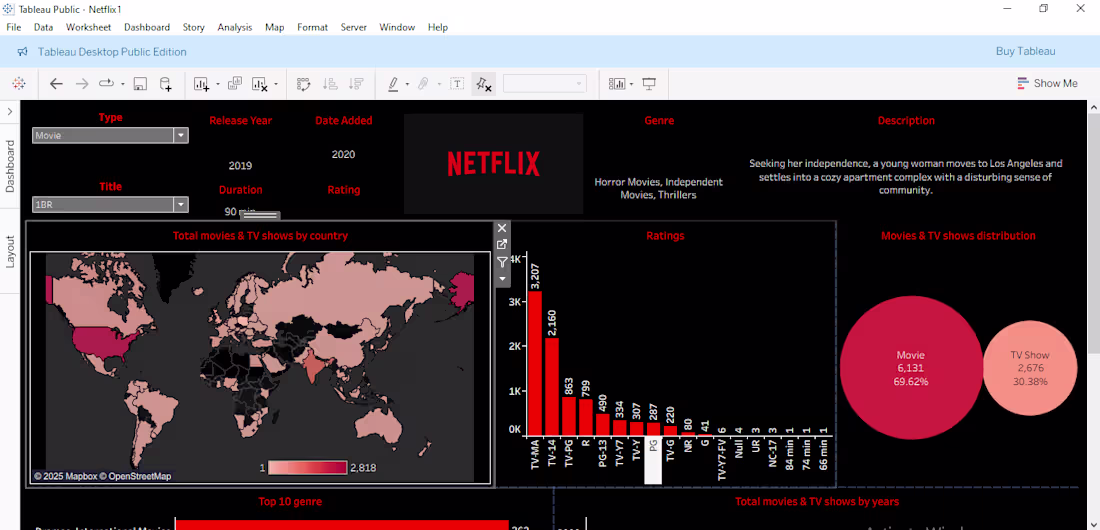
🎬 Netflix Titles Dashboard (Tableau)
Designed an interactive Tableau dashboard to analyse Netflix’s content library and uncover trends across genres, countries, and release years.
📊 Visualized content distribution between Movies & TV Shows
🌍 Analysed global content production with focus on top countries
📅 Identified growth trends in content additions over time
⭐ Explored ratings and genre patterns to understand audience targeting
💡 Delivered key insights on content diversity, growth, and viewing trends to support data-driven storytelling
🛠️ Tools Used: Tableau, Excel, Kaggle Dataset
🚀 Built a clean, interactive dashboard to transform raw data into meaningful visual insights
3
139
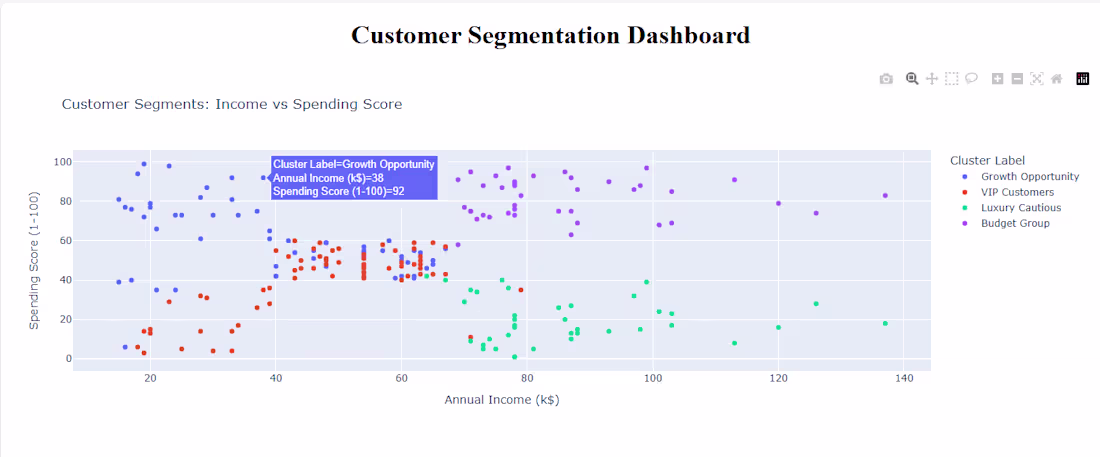
🛍️ Mall Customer Segmentation Project
Built an end-to-end machine learning solution to segment customers using K-Means clustering based on demographics and spending behaviour.
🔍 Performed data cleaning, pre-processing, and exploratory data analysis (EDA)
📊 Applied K-Means clustering with the Elbow Method to identify optimal customer segments
🧩 Engineered features to improve clustering performance
📈 Developed an interactive dashboard using Plotly Dash for real-time segment exploration
💡 Identified high-value and low-value customer groups, enabling targeted marketing and improved customer engagement strategies
🛠️ Tools Used: Python, Pandas, Scikit-learn, Plotly Dash
🚀 Delivered a business-focused solution for customer segmentation and data-driven decision-making
2
2
92
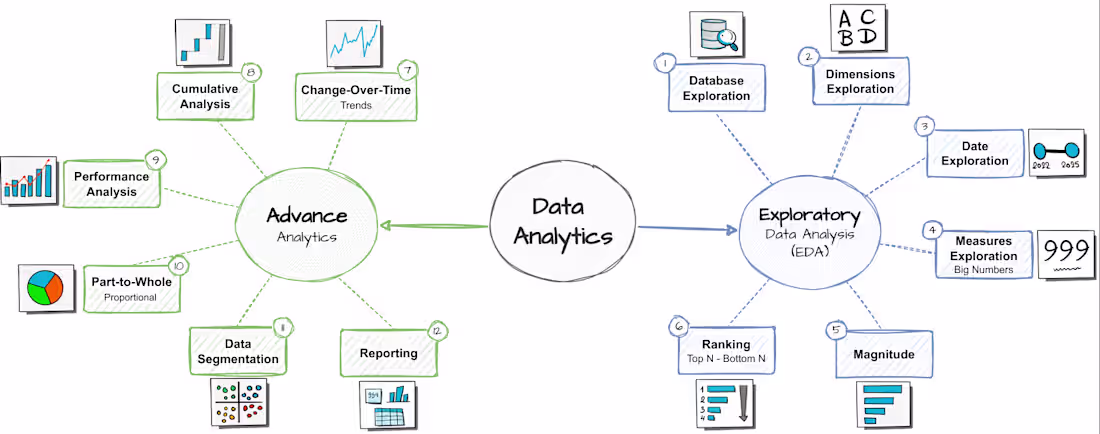
🚀 End-to-End Data Analytics Project
Transformed raw data into actionable business insights using a structured analytics pipeline:
Data Exploration → EDA → Advanced Analytics → Reporting
🔍 Conducted database exploration, schema analysis, and KPI identification
📈 Performed trend analysis, cumulative analysis, and performance benchmarking
🧩 Applied segmentation and part-to-whole analysis for deeper insights
📊 Delivered business-ready reporting and dashboard-ready outputs
🛠️ Tools Used: MS SQL Server
💡 Enabled data-driven decision-making through structured analysis and meaningful insights.
1
46
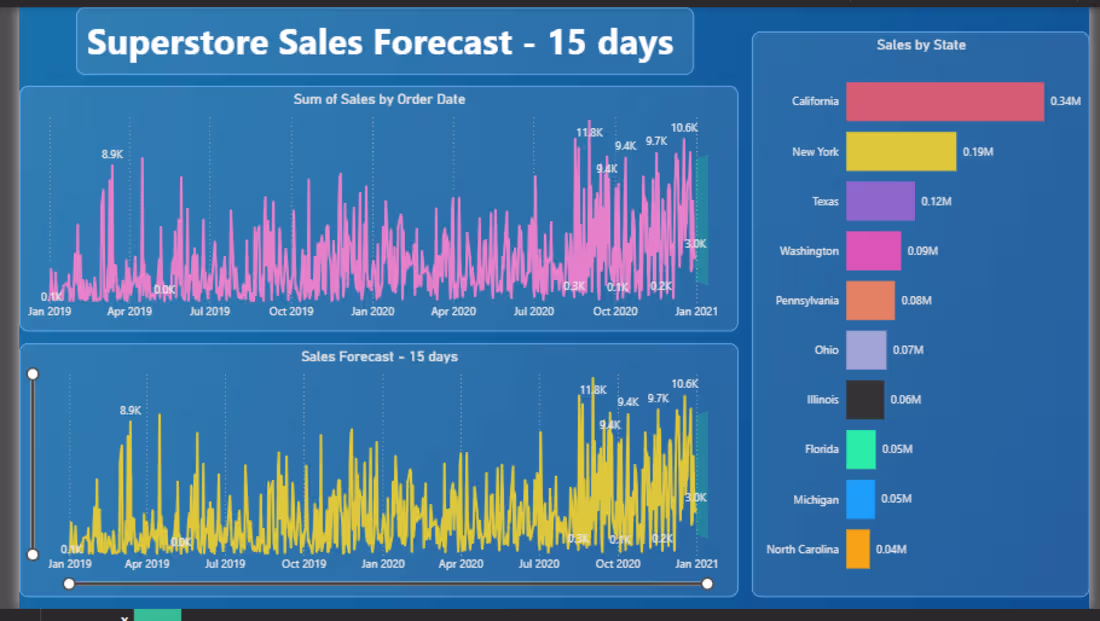
Superstore Sales Dashboard & Forecasting🙌
• Developed interactive dashboard analyzing 10,000+ transactions to track revenue and profit metrics.
• Performed trend analysis and 15-day forecasting, reducing manual reporting effort by 40%.
• Provided insights to improve inventory planning and sales monitoring.
4
3
201