
Suba K N
Data Analyst | Excel, SQL, Python, Power BI, Tableau
New to Contra
Suba is ready for their next project!

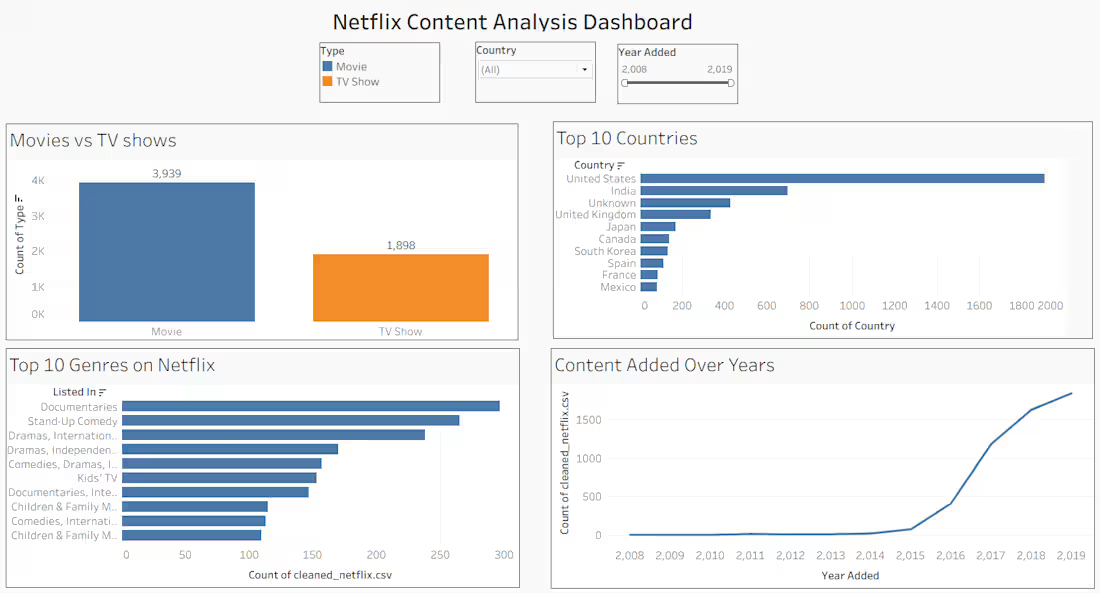
Created an interactive Tableau dashboard to analyze Netflix content by type, country, genre, and year added. The project highlights key insights such as the higher number of Movies compared to TV Shows, top contributing countries like the United States and India, popular genres, and the rapid growth of content after 2016. This project demonstrates skills in data cleaning using Python, data visualization, and dashboard design using Tableau.
1
2
67
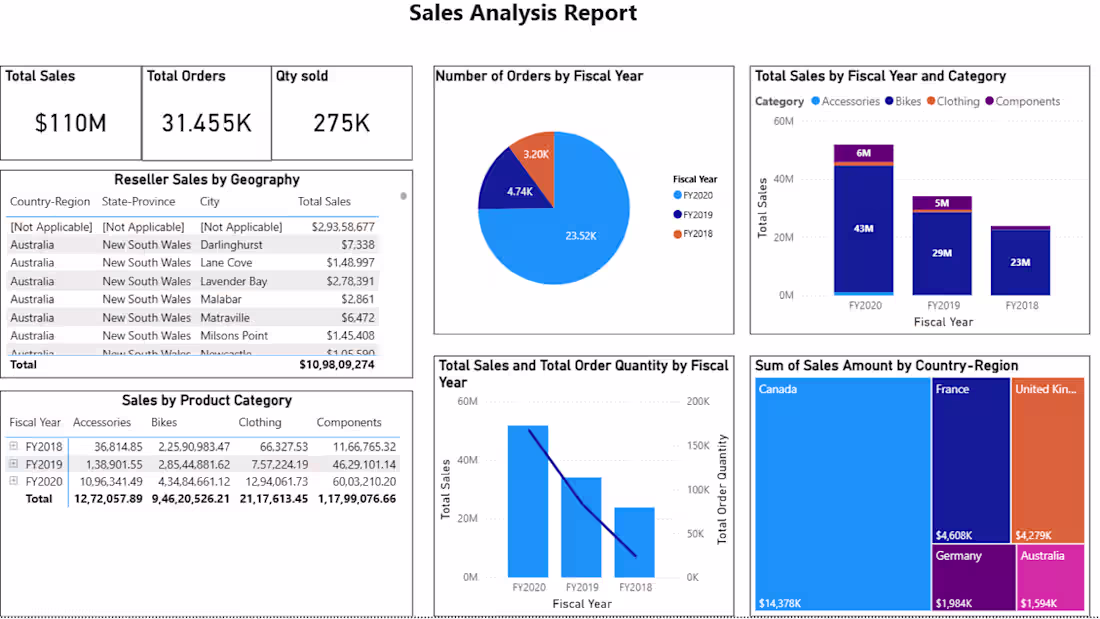
Created a Sales Analysis Report to evaluate overall sales performance and identify key trends. Used data visualization to highlight top-performing products, revenue patterns, and category insights. The report supports data-driven decision making through a clear and structured dashboard.
0
6
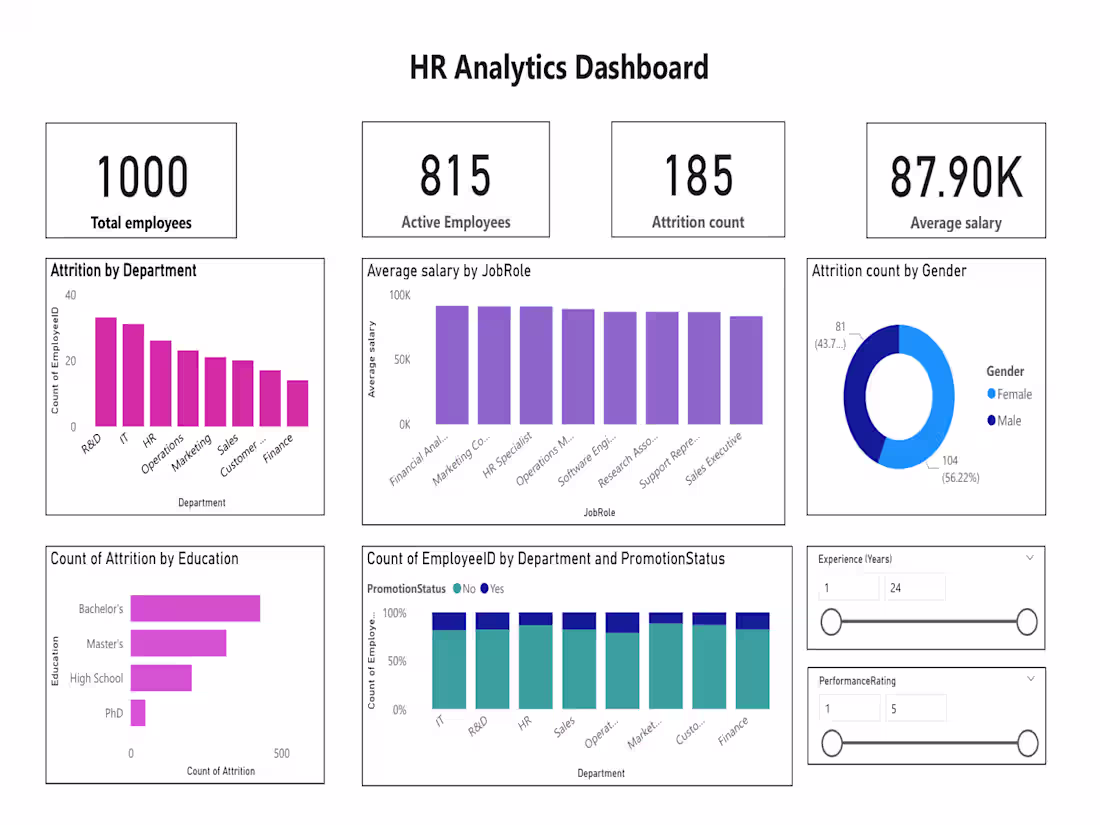
Built an interactive HR analytics dashboard to analyze employee attrition, department performance, salary distribution, and workforce insights. The dashboard helps organizations understand employee trends and support data-driven HR decisions.
0
34
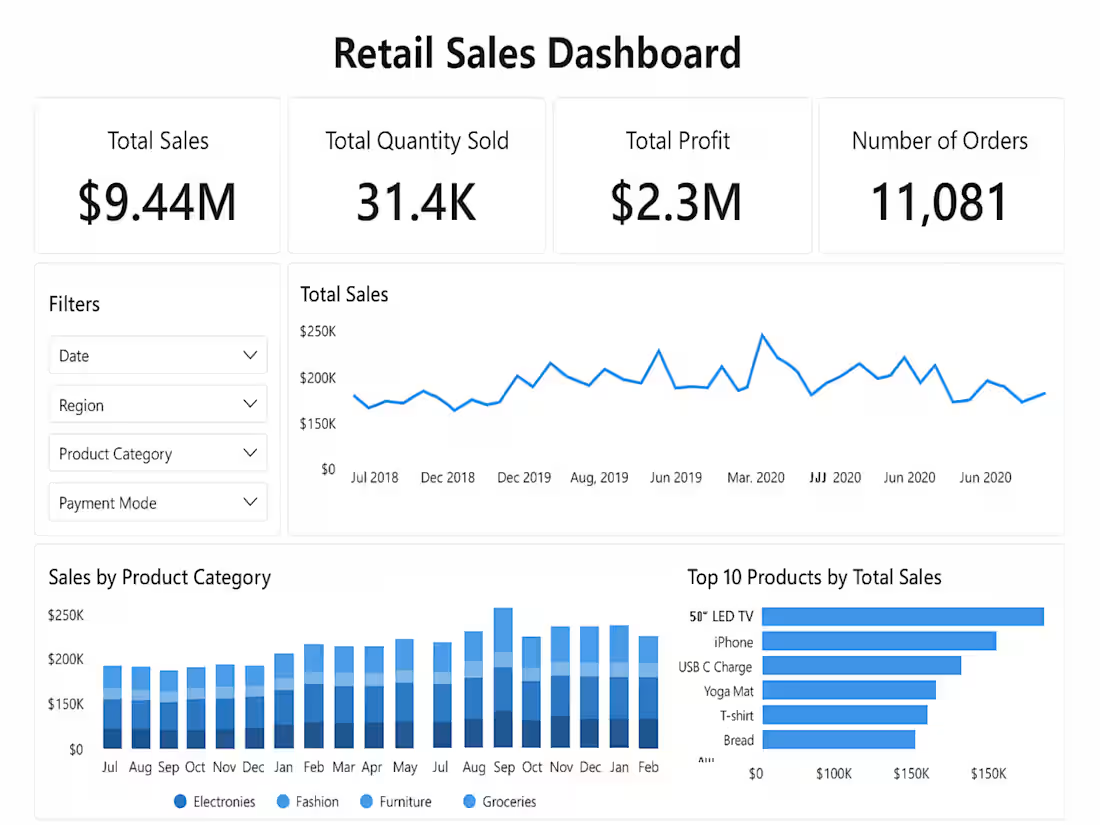
Developed a Retail Sales Dashboard to analyze key business metrics such as total sales, profit, quantity sold, and number of orders. The dashboard includes interactive filters for date, region, product category, and payment mode, helping users track sales trends and identify top-performing products for better decision-making.
2
2
100