
Urvi Walia
Transforming data into insights that drive growth with AI
New to Contra
Urvi is ready for their next project!
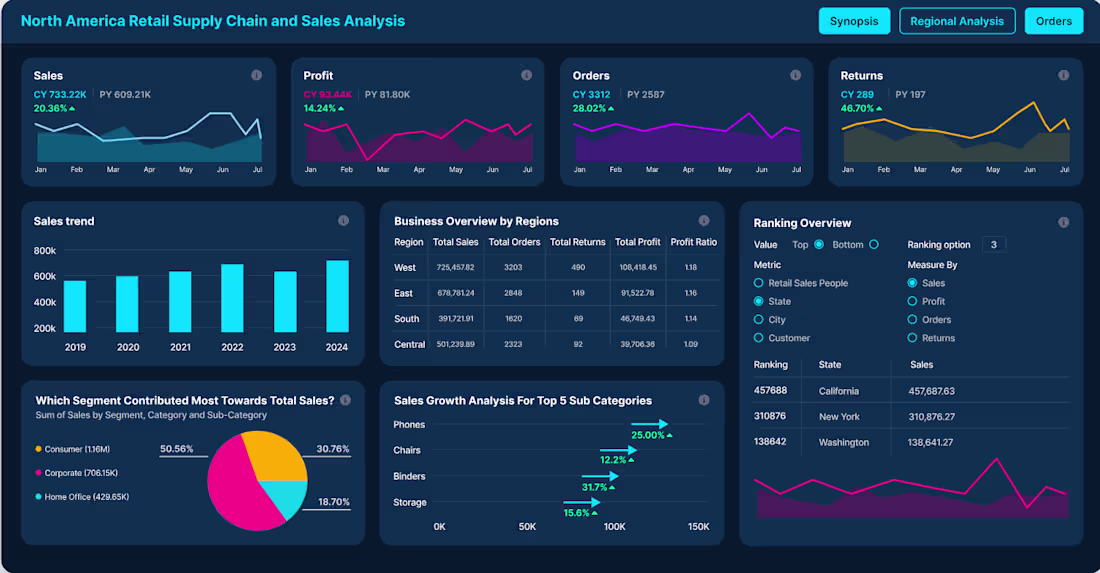
Sales Analysis Dashboard Project
Built an interactive Sales Analysis dashboard to track revenue, sales trends, product performance, and customer purchasing behavior. Analyzed sales data to identify growth opportunities and support data-driven business decisions.
Key Insights:
Identified top-performing products and sales regions
Analyzed monthly sales trends and customer buying patterns
Tracked KPIs to improve sales performance and forecasting
Skills Used:
Data Analysis • KPI Reporting • Data Visualization • Dashboard Development • Business Intelligence
Tools:
Power BI • Excel • SQL • Python
0
10
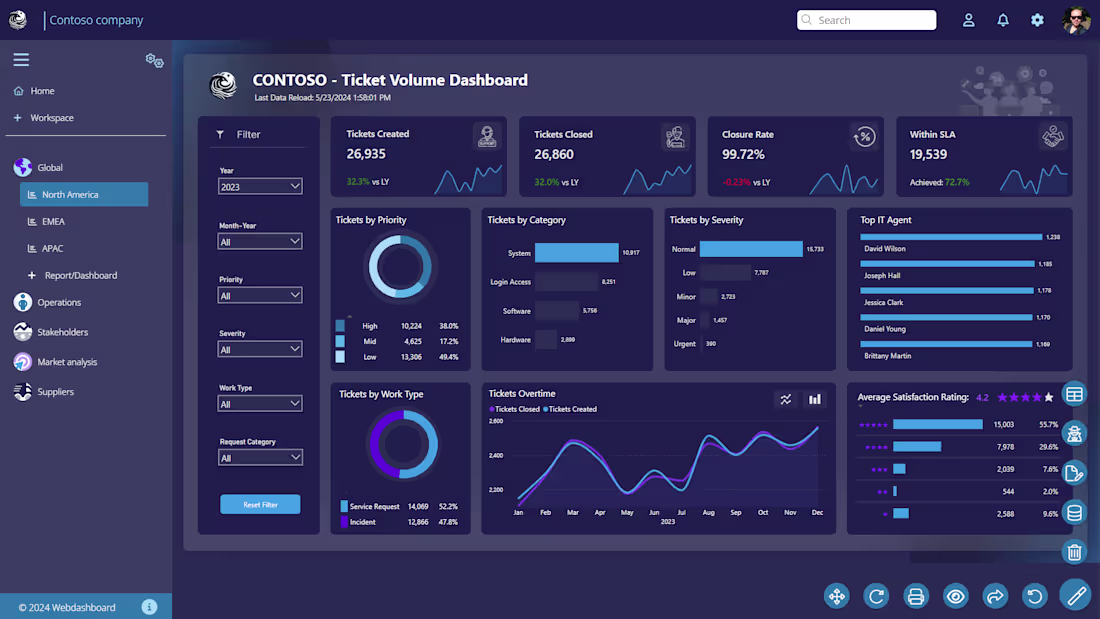
IT Service Management Dashboard Project
Developed an interactive IT Service Management dashboard to monitor ticket volume, incident trends, SLA performance, and support team efficiency. Analyzed operational support data to identify service bottlenecks, improve response times, and support data-driven operational decisions.
Key Business Insights & Decisions:
Monitored ticket creation and closure trends to improve operational efficiency
Identified high-priority and high-severity incidents requiring immediate attention
Tracked SLA compliance rates to reduce delayed ticket resolutions
Analyzed support categories and work types to optimize resource allocation
Evaluated top-performing IT agents based on ticket resolution performance
Improved service quality monitoring through customer satisfaction analysis
Dashboard Highlights:
Ticket Volume & Closure Tracking
SLA Performance Monitoring
Ticket Priority & Severity Analysis
Support Category Breakdown
IT Agent Performance Analysis
Customer Satisfaction Metrics
Interactive Filters for Dynamic Reporting
Skills Used:
Data Cleaning & Transformation
Exploratory Data Analysis (EDA)
KPI Monitoring & Reporting
Operational Data Analysis
Data Visualization
Dashboard Development
Business Intelligence Reporting
Insight-Driven Decision Making
Tools & Technologies:
Power BI • Excel • SQL • Python • DAX • Data Visualization
0
13
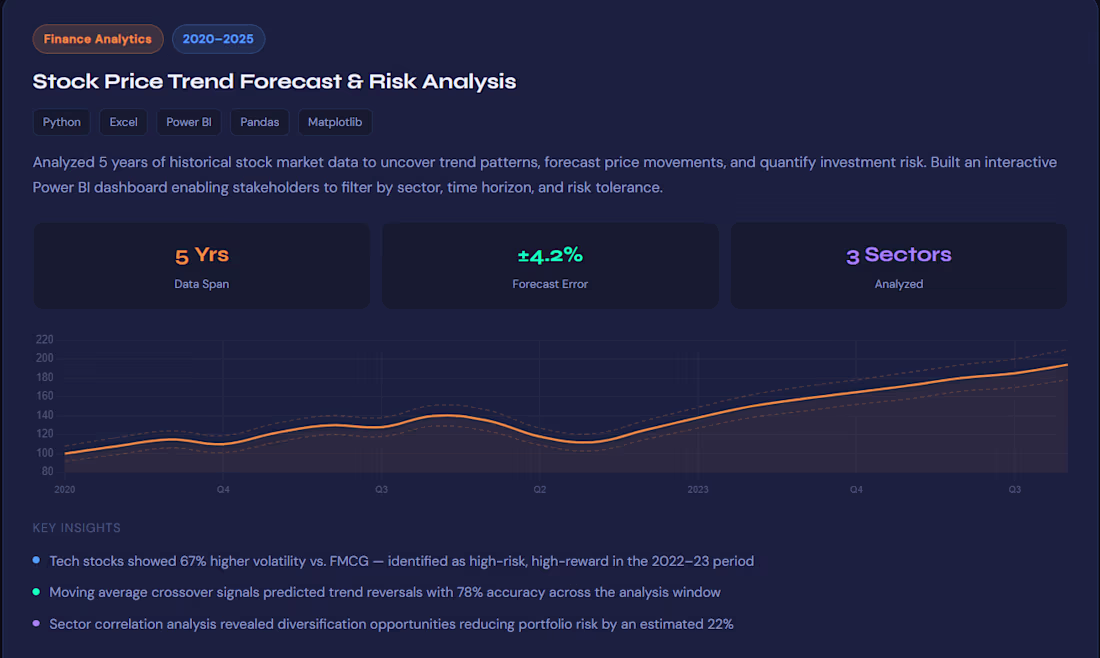
Tesla Sales & Market Analysis Project
Conducted a data-driven analysis of Tesla’s sales performance, market trends, and customer demand patterns using real-world datasets. Cleaned and analyzed large datasets to identify revenue trends, regional performance, and key business insights that could support strategic decision-making.
Key Business Insights & Decisions:
Identified top-performing sales regions and revenue-driving markets
Analyzed customer demand trends to understand purchasing behavior
Detected seasonal sales patterns to support forecasting strategies
Helped highlight opportunities for improving sales performance and market targeting
Built interactive dashboards for easy tracking of KPIs and business metrics
Skills Used:
Data Cleaning & Preprocessing
Exploratory Data Analysis (EDA)
Sales Trend Analysis
Data Visualization
Dashboard Development
Business Intelligence Reporting
KPI Analysis
Business Insight Generation
Tools & Technologies:
Excel • Python • SQL • Power BI • Pandas • Matplotlib
0
20
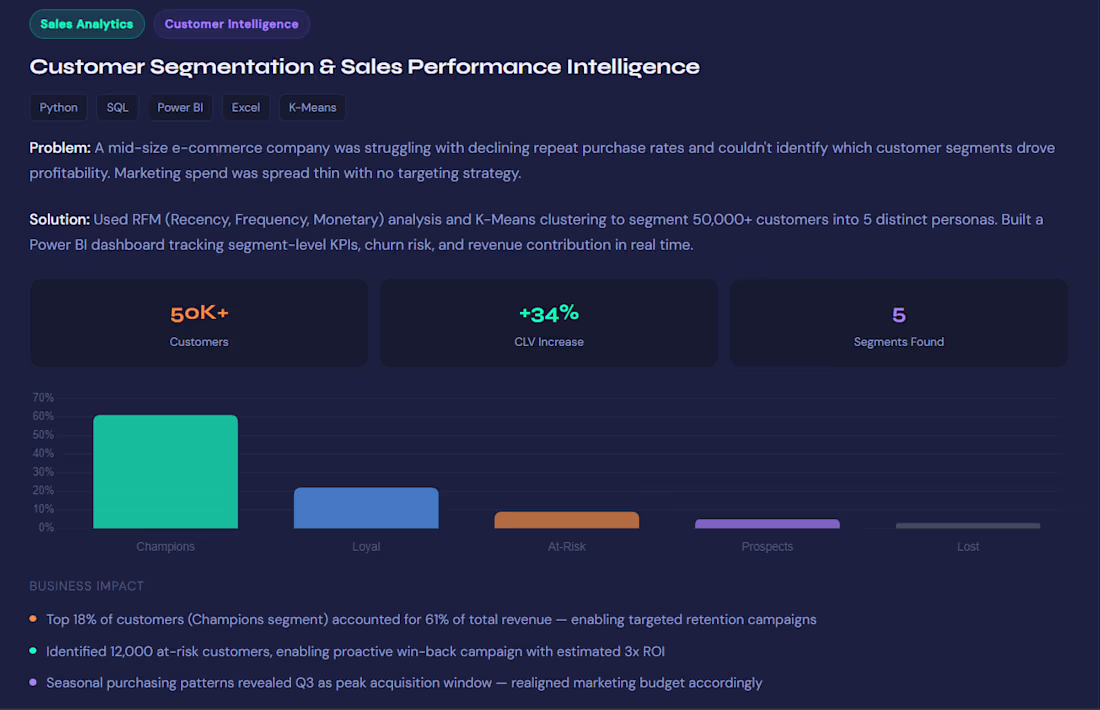
Customer Segmentation Case Study
Analyzed customer purchasing behavior using data analysis techniques to identify high-value customer segments and buying patterns. Cleaned and processed raw customer data using Excel and Python, then created interactive dashboards in Power BI to visualize customer demographics, spending habits, and retention trends.
Key Business Improvements & Decisions:
Identified the most profitable customer groups for targeted marketing
Helped optimize marketing campaigns based on customer behavior
Suggested personalized offers for high-value customers to improve retention
Reduced unnecessary marketing spend by focusing on the right audience segments
Improved decision-making through clear KPI dashboards and customer insights
Tools Used:
Excel • Python • SQL • Power BI
0
21