Operator Scoreboard — Power BI
Huzaifa Moin
Operator Scoreboard — Power BI Dashboard
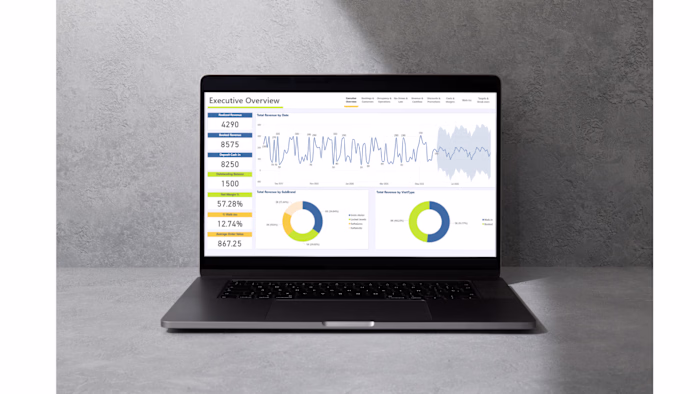
Built a real-time operator scoreboard in Power BI to track the core revenue activity chain for a real estate acquisitions business. The dashboard monitors three metrics — Seller Conversations (daily), Offers Presented (weekly), and Deals Closed (monthly) — and visualizes them as a live funnel with conversion rates at each stage.
Key features include dynamic KPI cards with vs-yesterday trend indicators, a custom horizontal funnel chart with conv→offer and offer→close rates, offer type breakdown by Lightning Close, FlexPayout, and MarketMax, owner-level drill-down between two operators, and a 30/90-day trend view with a rolling closings chart. All visuals respond to a period slicer covering This Month, This Week, Last 30 Days, and Last 90 Days.
Built entirely with DAX including time intelligence measures, VAR-optimized calculations, and conditional formatting via field value color measures.
Like this project
Posted Mar 28, 2026
Operator Scoreboard — Power BI Dashboard Built a real-time operator scoreboard in Power BI to track the core revenue activity chain for a real estate acquisi...