BYD Cover Installation Progress Dashboard
Huzaifa Moin
BYD Cover Installation Progress Dashboard | Project Management (Sep 2025)
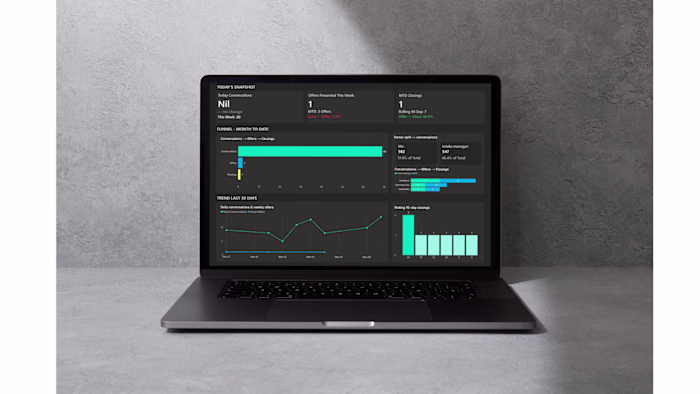
Built a Power BI progress tracking dashboard for a BYD cover installation project spanning 7 zones. The dashboard surfaces real-time completion rates by zone, daily installation counts, and cumulative progress trends to give project managers a clear picture of where work is on track and where it is stalled.
Key findings surfaced by the dashboard: Zones 5 and 6 are fully complete and Zone 7 is at 98.75%, while Zones 1, 2, and 3 have not started — creating a visible backlog risk. Daily output has been highly volatile, with peaks of 680 installations and multiple zero-progress days, pointing to either work stoppages or reporting gaps.
The dashboard enabled the team to identify resource reallocation opportunities from completed zones, investigate zero-progress days, and prioritize initiation of the three unstarted zones to protect the delivery timeline.
Like this project
Posted Mar 28, 2026
BYD Cover Installation Progress Dashboard | Project Management (Sep 2025) Built a Power BI progress tracking dashboard for a BYD cover installation project s...