EV Charging Station Analysis – Power BI Dashboard
Abhijeet Gaykwad
🚀 Project Overview
The rapid adoption of electric vehicles (EVs) has created an urgent need for optimized charging infrastructure. To address this, I developed a comprehensive Power BI dashboard that analyzes key aspects of EV charging stations, including charging capacity, cost analysis, geographical distribution, parking availability, maintenance impact, and sustainability insights.
This project provides data-driven solutions for decision-makers in the EV industry, urban planners, and policymakers, enabling them to optimize station placement, manage operational costs, and improve service efficiency.
🎯 Project Objectives
🔹 Evaluate charging station efficiency based on usage, capacity, and location.
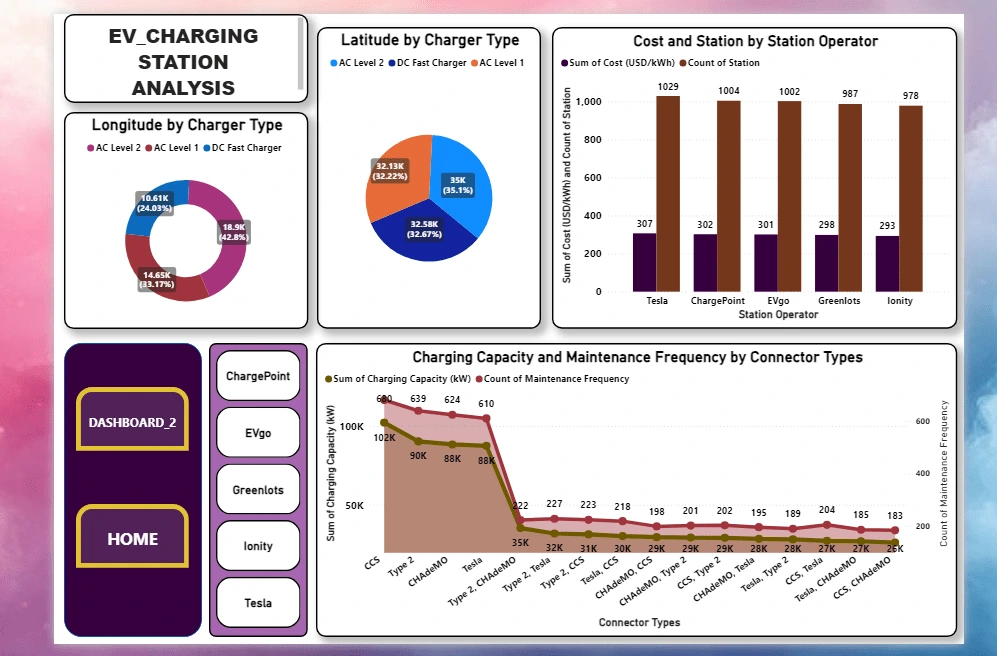
🔹 Analyze cost variations across different station operators.
🔹 Identify trends in charger type adoption (AC Level 1, Level 2, DC Fast Chargers).
🔹 Assess the impact of maintenance frequency on customer reviews.
🔹 Measure parking availability and its effect on station accessibility.
🔹 Analyze the role of renewable energy sources in EV infrastructure.
📊 Key Data Insights & Business Impact
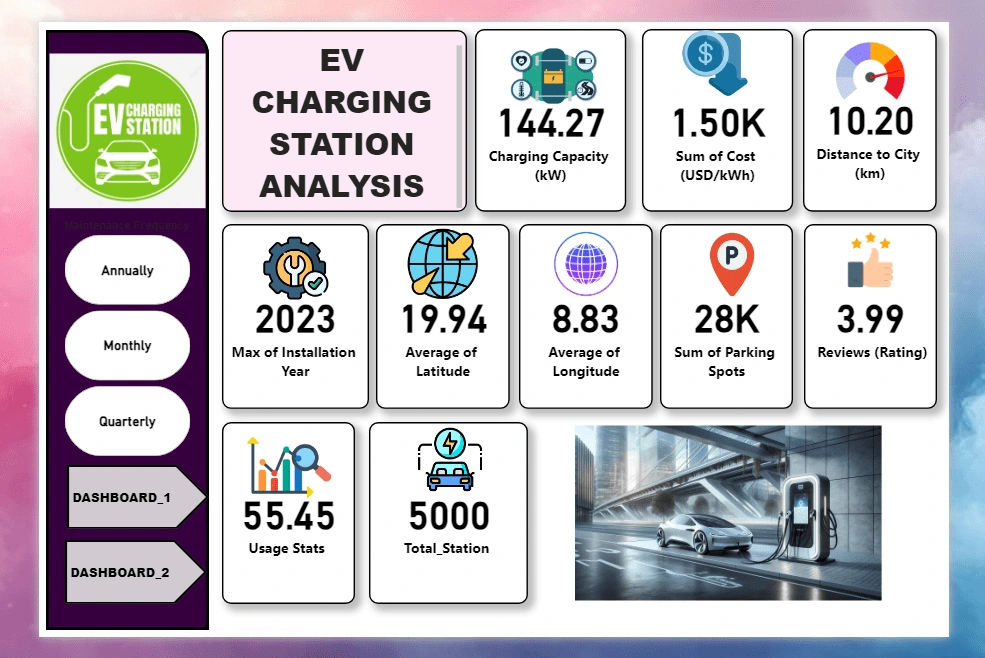
🔋 Charging Capacity & Cost Analysis
Total Charging Capacity: 144.27 kW across multiple stations.
Cost Comparison of Leading Operators:
Tesla: $1,029 USD/kWh (307 stations).
ChargePoint: $1,004 USD/kWh (302 stations).
EVgo, Greenlots, and Ionity analyzed for cost efficiency.
🌍 Geographical Distribution & Accessibility
Max Year of Installation: 2023, highlighting rapid expansion.
Average Latitude & Longitude: (19.94, 8.83) for global insights.
Average Distance to City Centers: 10.2 km, aiding accessibility planning.
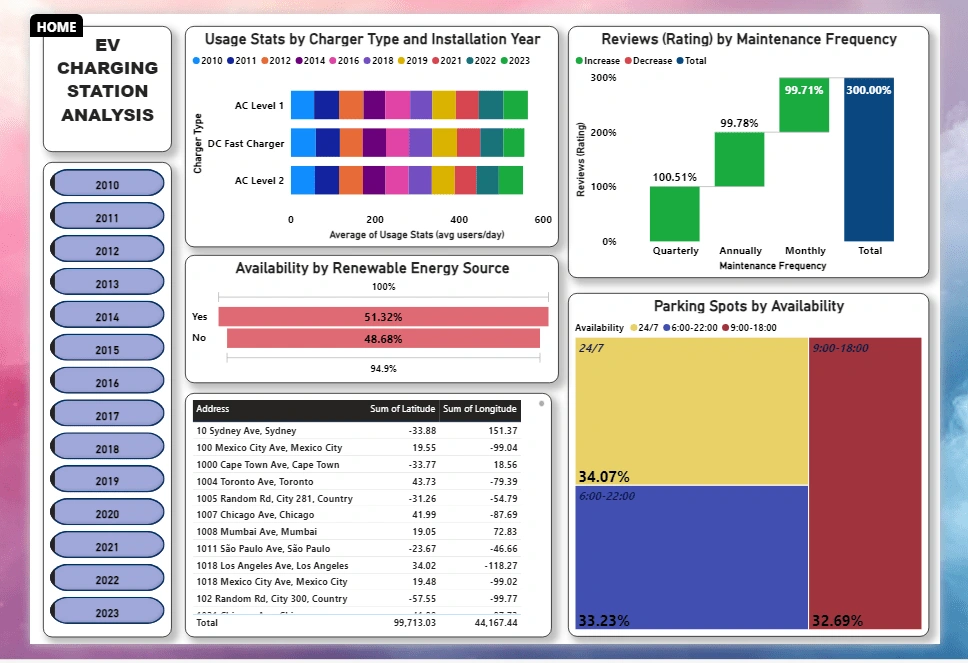
🅿️ Parking & Availability Insights
Total Parking Spots: 28,000 across all locations.
Availability Breakdown:
24/7 Open Parking: 34.07%
6:00 AM – 10:00 PM Availability: 33.23%
Limited Hours (9:00 AM – 6:00 PM): 32.69%
⚡ Usage & Maintenance Impact
Average Daily Usage Per Station: 55.45 sessions/day.
Effect of Maintenance on Ratings:
Quarterly Maintained Stations: 100.51% rating improvement.
Monthly Maintained Stations: 99.71% positive reviews.
Annually Maintained Stations: 99.78% user satisfaction.
🌱 Renewable Energy Integration
Stations Using Renewable Energy: 51.32%
Non-Renewable Powered Stations: 48.68%
Sustainability Score: 94.9% compliance with green initiatives.
📌 Business & Industry Impact
✅ Optimized EV Charging Network:
Insights help urban planners & policymakers improve charging infrastructure.
Identifies high-demand areas for new installations.
✅ Cost Efficiency & Profitability:
Comparison of station operators helps businesses optimize pricing models.
Charging cost insights enable better revenue strategies.
✅ Improved Customer Experience & Sustainability:
Renewable energy adoption trends guide green energy expansion.
Parking availability data ensures higher station accessibility.
Maintenance frequency analysis helps improve customer satisfaction ratings.
🛠️ Tools & Technologies Used
💡 Power BI:
Data Modeling & Cleaning
DAX (Data Analysis Expressions)
Interactive Dashboards & Visualizations
💡 SQL & Excel:
Data Extraction, Transformation, and Loading (ETL)
Preprocessing and Statistical Analysis
💡 Data Visualization Techniques:
Geospatial Analysis: Mapping stations based on latitude & longitude.
Time-Series Analysis: Installation trends over the years.
Comparative Analysis: Charging costs by operator & station.
🔗 How This Project Adds Value
💼 For Businesses & Startups: Helps EV charging companies optimize pricing, improve infrastructure, and plan new station locations based on demand.
🏙️ For Urban Planners & Governments: Assists city officials in identifying areas needing better charging access and renewable energy adoption.
🔬 For Data Enthusiasts & Analysts: Showcases how data visualization & Power BI can uncover valuable insights from large datasets.
🚀 Conclusion
This EV Charging Station Analysis provides a comprehensive overview of charging infrastructure, allowing stakeholders to make informed decisions about cost, capacity, accessibility, and sustainability.
With interactive dashboards, real-time insights, and advanced data analytics, this project is a powerful tool for the future of electric mobility.
Like this project
Posted Feb 17, 2025
EV Charging Station Analysis: Analyzed charging capacity, costs, usage, and sustainability trends using Power BI for data-driven insights. 🚀🔋