Social Media and Entertainment Overview Dashboard
Abhijeet Gaykwad
📌 Project Overview:
This interactive Power BI dashboard provides in-depth insights into social media and entertainment consumption patterns worldwide. It presents key metrics related to digital engagement, user behavior, internet speed, and financial aspects of content consumption. The dashboard is designed to help businesses, analysts, and marketers understand how users interact with various digital platforms.
📊 Key Features & Insights:
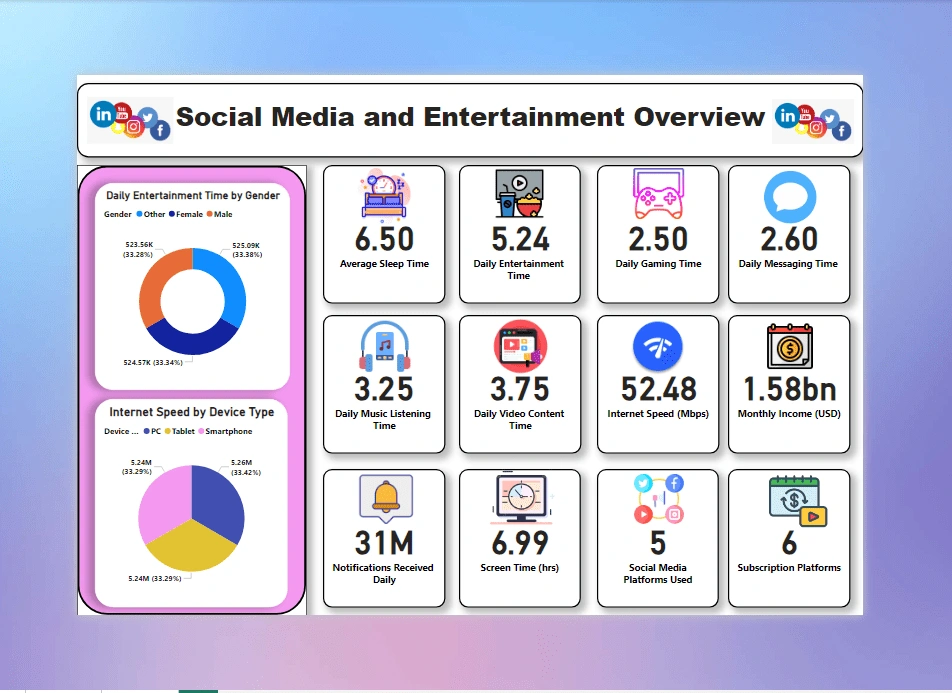
1️⃣ User Behavior Analysis:
✔ Daily Entertainment Trends: The dashboard tracks entertainment time, gaming time, messaging activity, and music/video consumption habits.
✔ Average Screen Time: A breakdown of total daily screen usage across different activities.
✔ Notifications Received: Analyzing user engagement levels through daily notifications.
2️⃣ Demographic Breakdown:
✔ Entertainment Time by Gender: Visualizing entertainment consumption patterns among male, female, and other gender groups.
✔ Internet Speed by Device Type: Comparison of PCs, tablets, and smartphones in terms of internet speed efficiency.
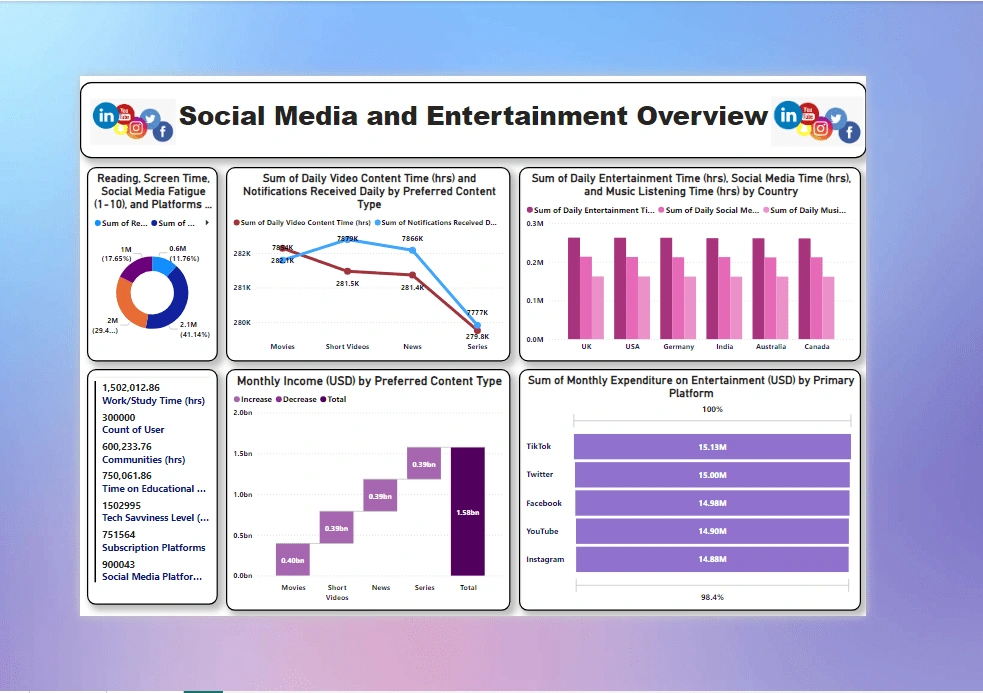
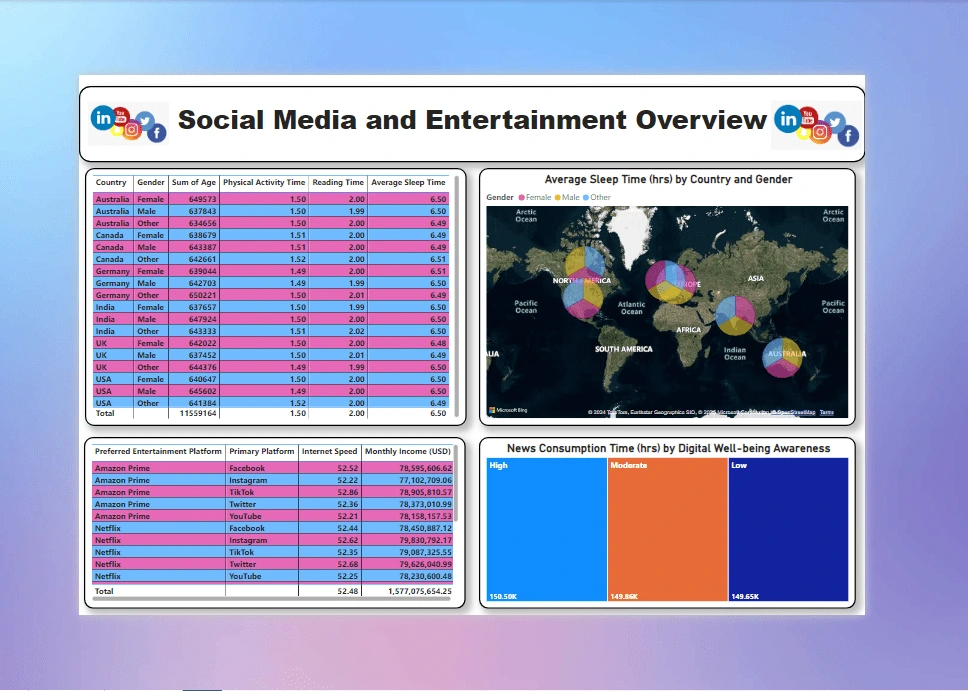
✔ Regional Consumption Trends: Social media, music, and entertainment usage are analyzed across countries like the UK, USA, Germany, India, Australia, and Canada.
3️⃣ Content & Platform Insights:
✔ Preferred Content Types: Examining engagement in movies, short videos, news, and series to understand what type of content users consume the most.
✔ Monthly Expenditure on Entertainment: Tracking how much users spend on different subscription platforms and content types.
✔ Social Media Platform Usage: Identifying which platforms (TikTok, Facebook, Twitter, YouTube, Instagram) receive the highest engagement and spending.
🛠 Tools & Technologies Used:
✅ Power BI – Data visualization and dashboard design
✅ DAX (Data Analysis Expressions) – Custom calculations and metrics
✅ Power Query – Data transformation and preprocessing
✅ SQL/Excel (if used) – Data extraction and preparation
📥 Data Sources:
Social media usage reports
Entertainment industry statistics
Internet speed analysis by device
📌 Why This Project Matters:
This dashboard helps businesses, marketers, and data analysts make data-driven decisions on content strategy, platform engagement, and entertainment trends. By leveraging insights from user behavior, regional preferences, and spending habits, companies can optimize their digital content to better serve their audience.
Like this project
Posted Feb 18, 2025
An interactive Power BI dashboard analyzing social media and entertainment trends, user behavior, and spending.