AgSol – Mapping the Future of Farming
Abdurrahman Sheriff
AgSol – Mapping the Future of Farming
Simplifying complex agronomic data through a map-first, satellite-powered web and mobile platform.
Role: Lead Product Designer (UI/UX)
Platform: Responsive Web & Mobile App
Deliverables: Spatial UI Design, Data Visualization, Cross-Platform Architecture
Tools Used: Figma, Jitter (Motion)
The Context: The Disjointed Farm Problem
AgSol is an Agritech platform built to help farm managers oversee vast, often disjointed parcels of land. Modern farming relies heavily on data—satellite imagery, crop health indexes, yield forecasting, and weather patterns. The problem? Most existing agricultural software is overwhelmingly dense, looking more like an Excel spreadsheet than an actionable dashboard.
The Challenge: Data Without the Clutter
The primary users of AgSol are farm managers and agronomists who need quick insights while in the field or the office. The design challenge was figuring out how to display massive amounts of complex satellite and AI-driven data without cluttering the screen or intimidating non-technical users.
The Solution: A Map-First Spatial UI
To solve the clutter issue, I designed a deeply immersive, map-first interface for both desktop and mobile.
Instead of forcing users to navigate through traditional tables and menus, the entire platform is anchored by a high-resolution satellite map. I utilized strict progressive disclosure:
The default view is clean, showing only the overarching farm boundaries and health heat-maps.
When a user clicks or taps on a specific parcel of land, a sleek side-panel smoothly slides in, revealing the deep-dive metrics (yield forecasts, AI chat insights, and crop health) specific only to that plot.
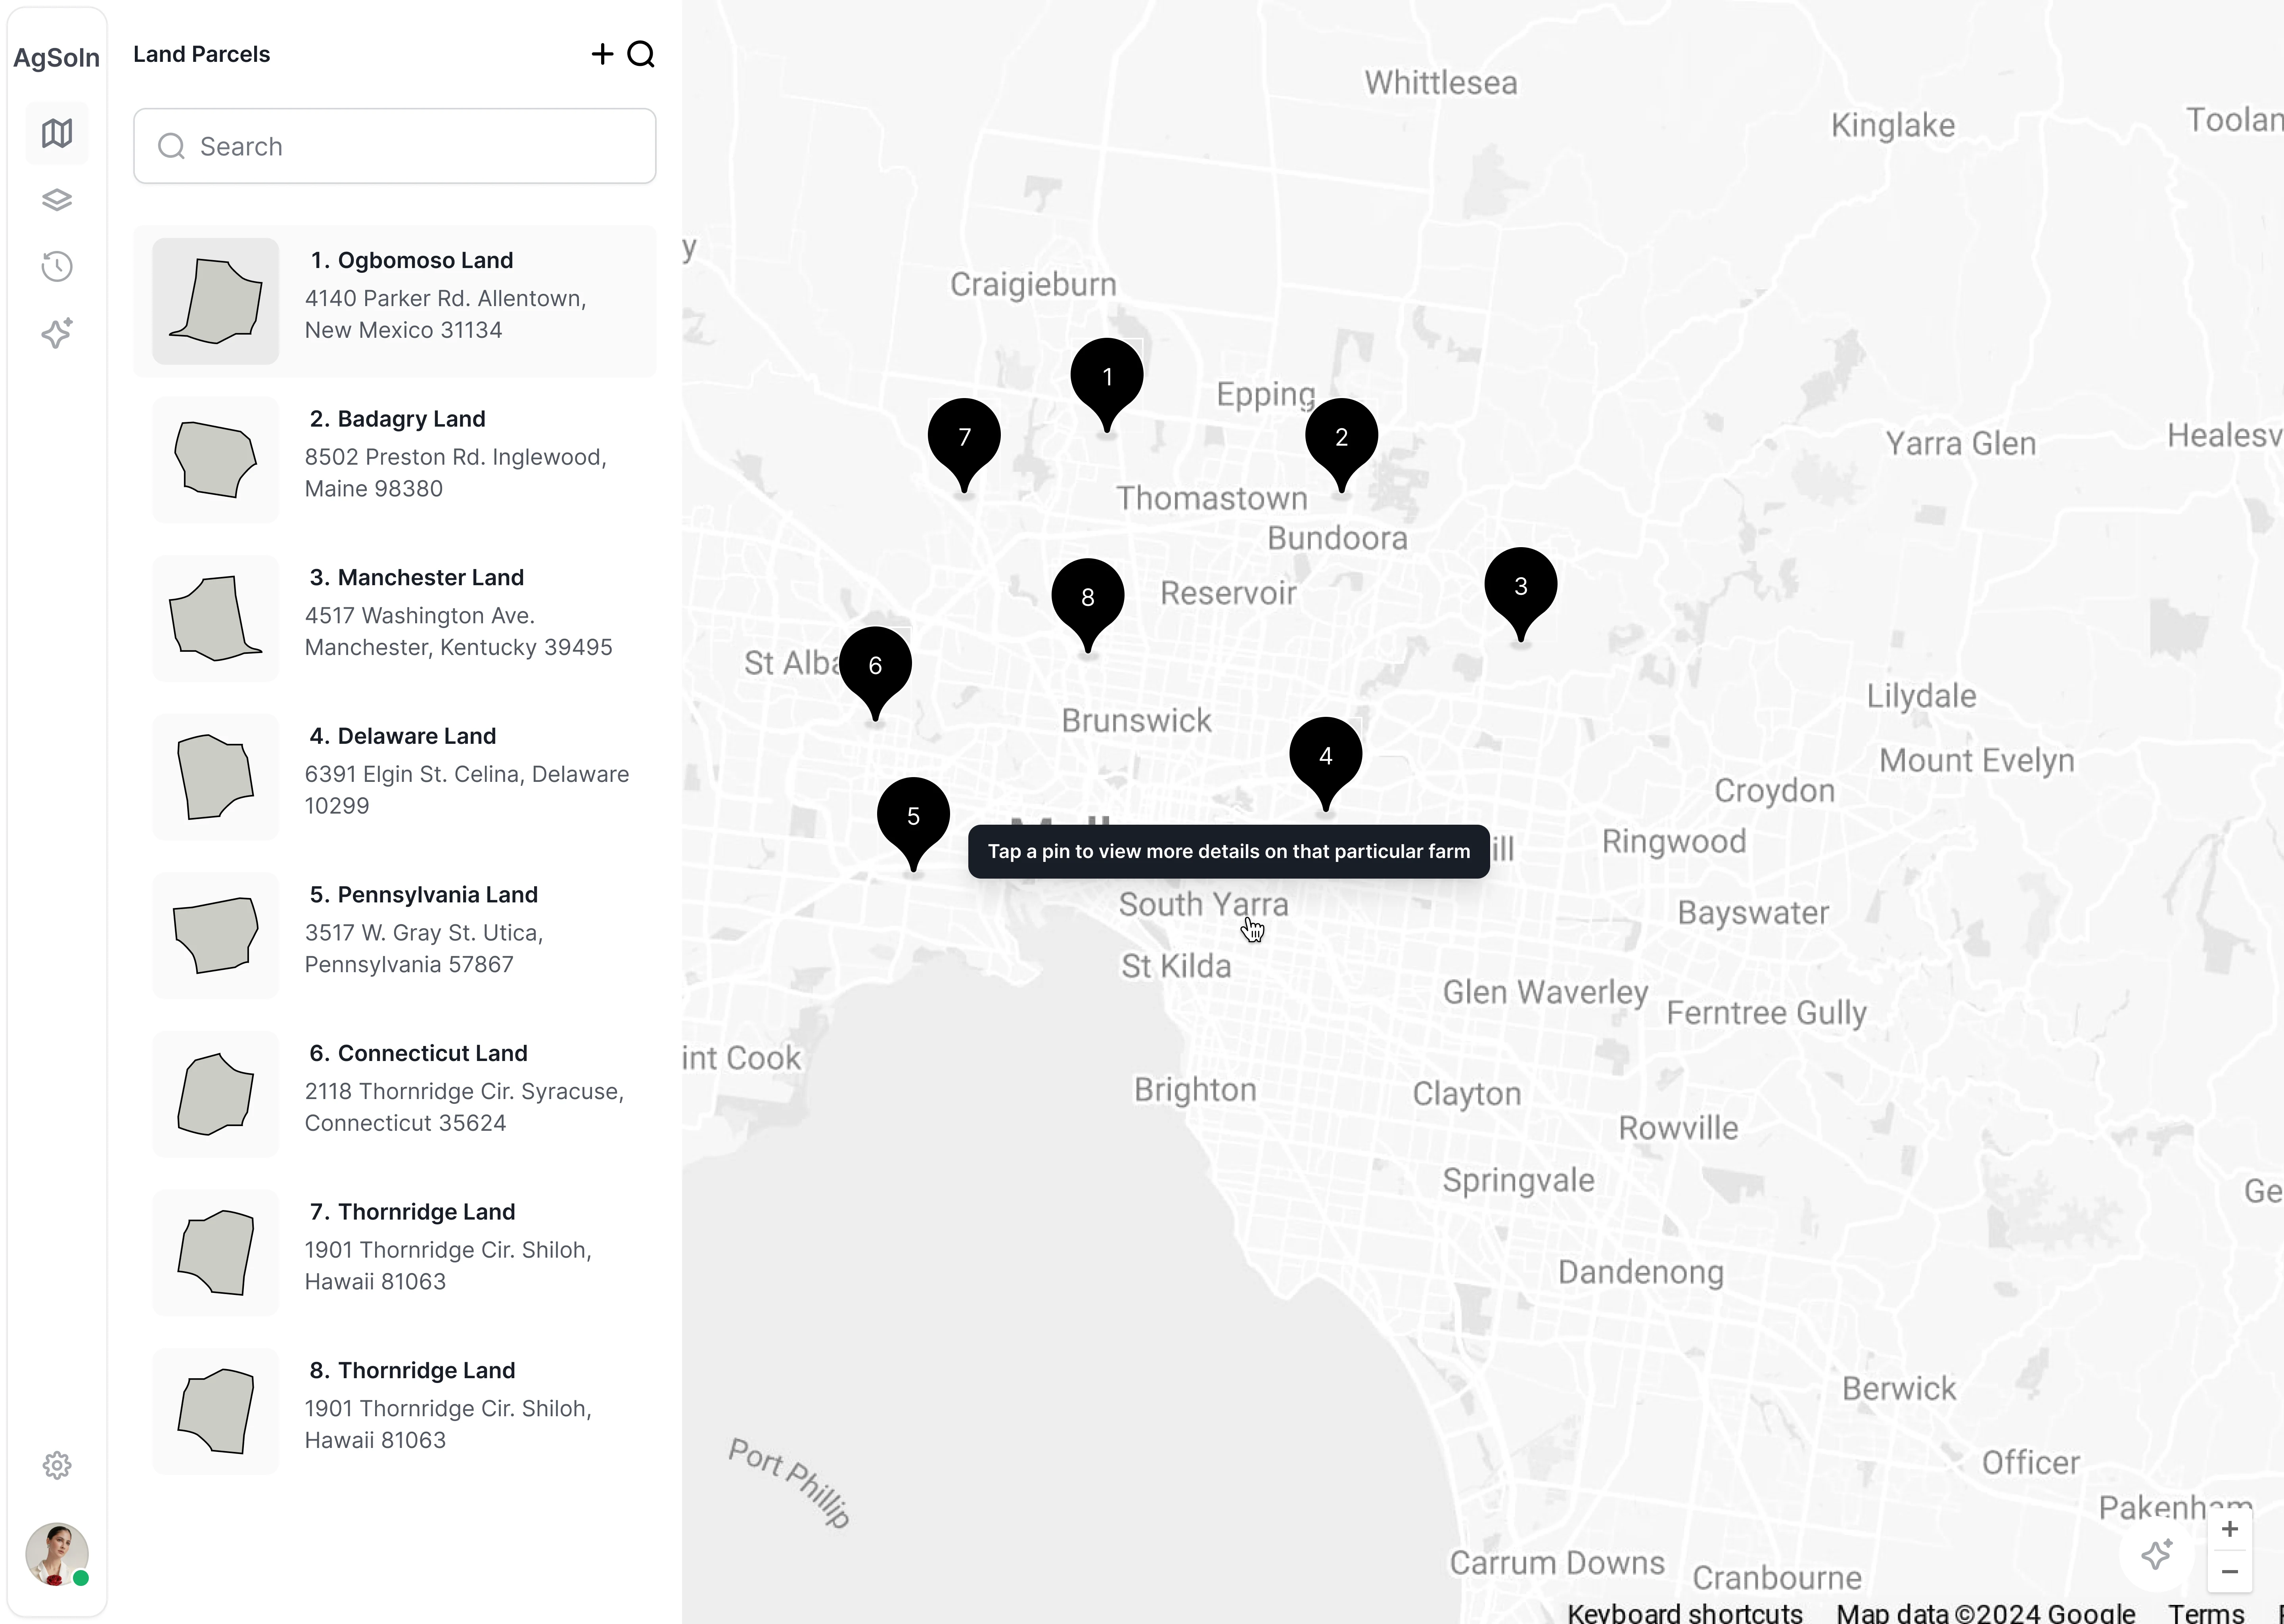
Main Dashboard page of all land parcels
The Outcome
By anchoring the UX in geography rather than spreadsheets, AgSol transforms overwhelming agronomic data into an intuitive, highly visual experience. The responsive design ensures that whether a manager is at a desktop or using their phone in the middle of a field, the data remains accessible, legible, and immediately actionable.
Like this project
Posted Mar 20, 2026
A map-first Agritech dashboard simplifying geospatial data. It translates satellite imagery and AI yield forecasts into clear UI for disjointed farm parcels.
Likes
1
Views
1
Timeline
Sep 29, 2025 - Nov 9, 2025