
Overview
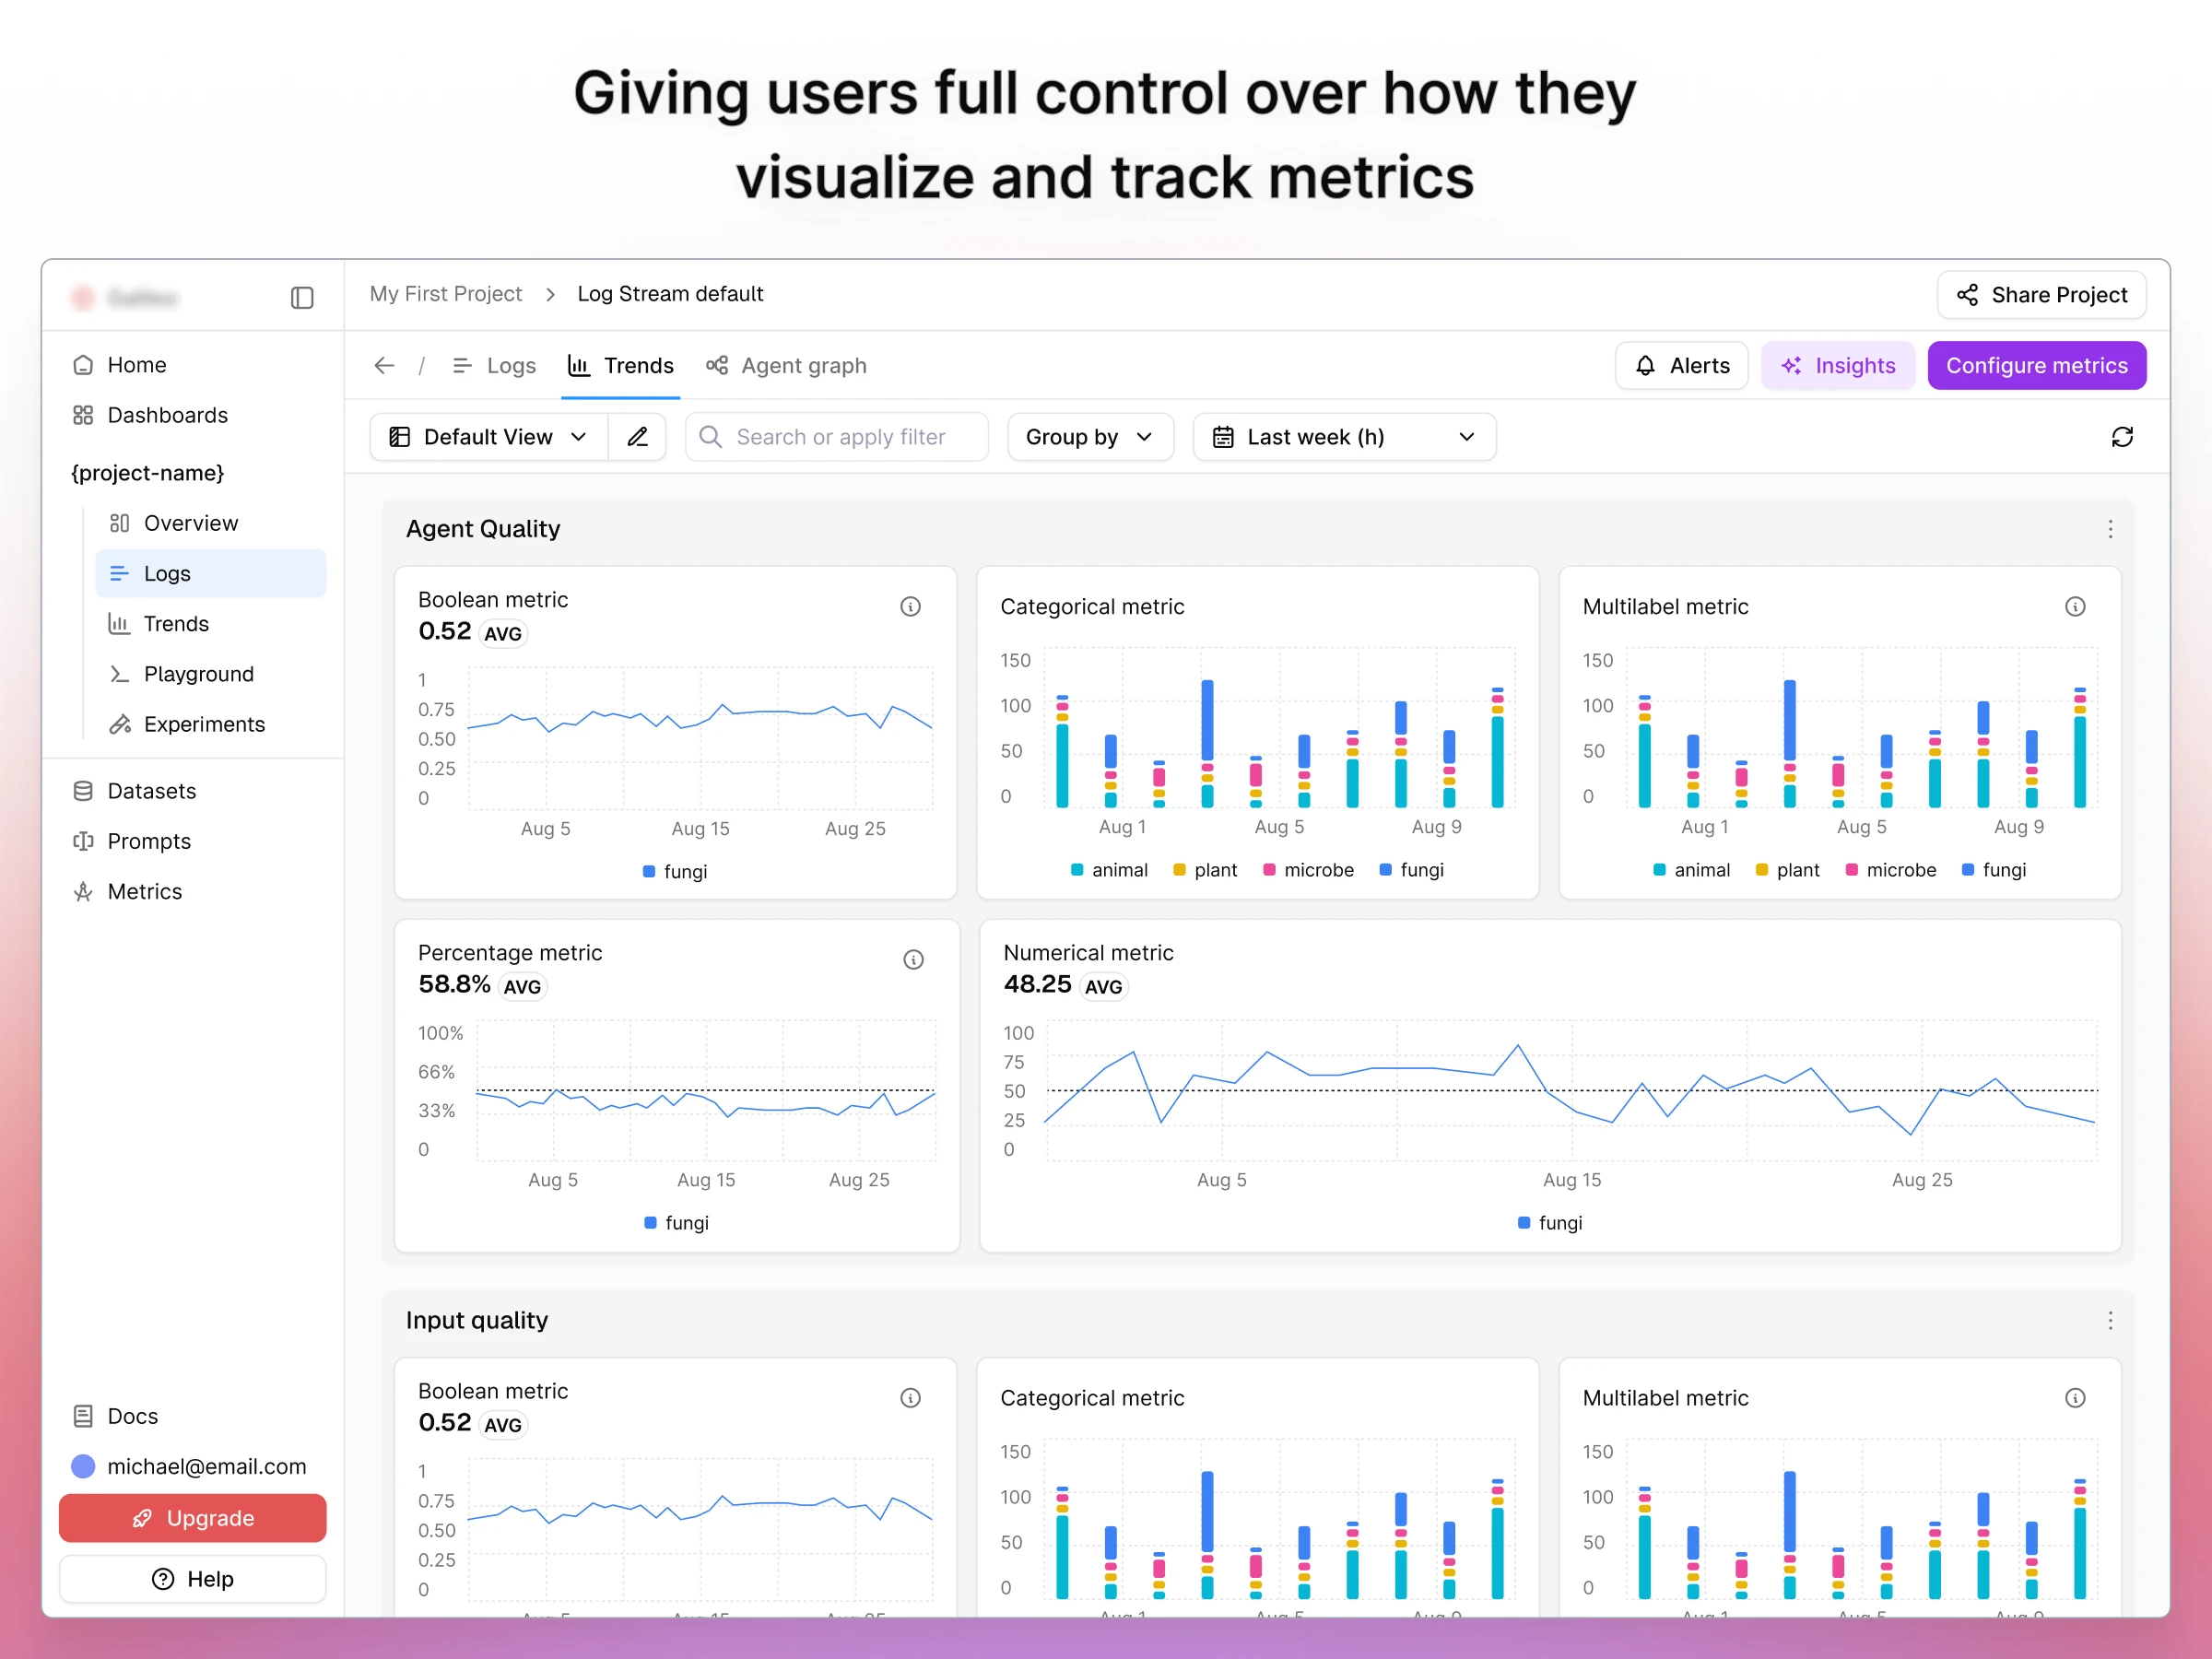
Designed a custom dashboarding system for an AI platform, allowing users to create flexible dashboards and visualize key data in one place.
Goal
Enable users to build custom dashboards and charts to monitor relevant metrics without relying on predefined views.
Challenges
The key challenge was designing a flexible system that supports different use cases without becoming overly complex. Users needed powerful customization, but the interface had to remain intuitive and easy to use.
Solutions / Outcome
Designed a modular dashboard system with customizable charts and flexible layouts.
Focused on clarity, usability, and scalability to support different data needs.The feature was successfully shipped, giving users more control over how they explore and monitor data.
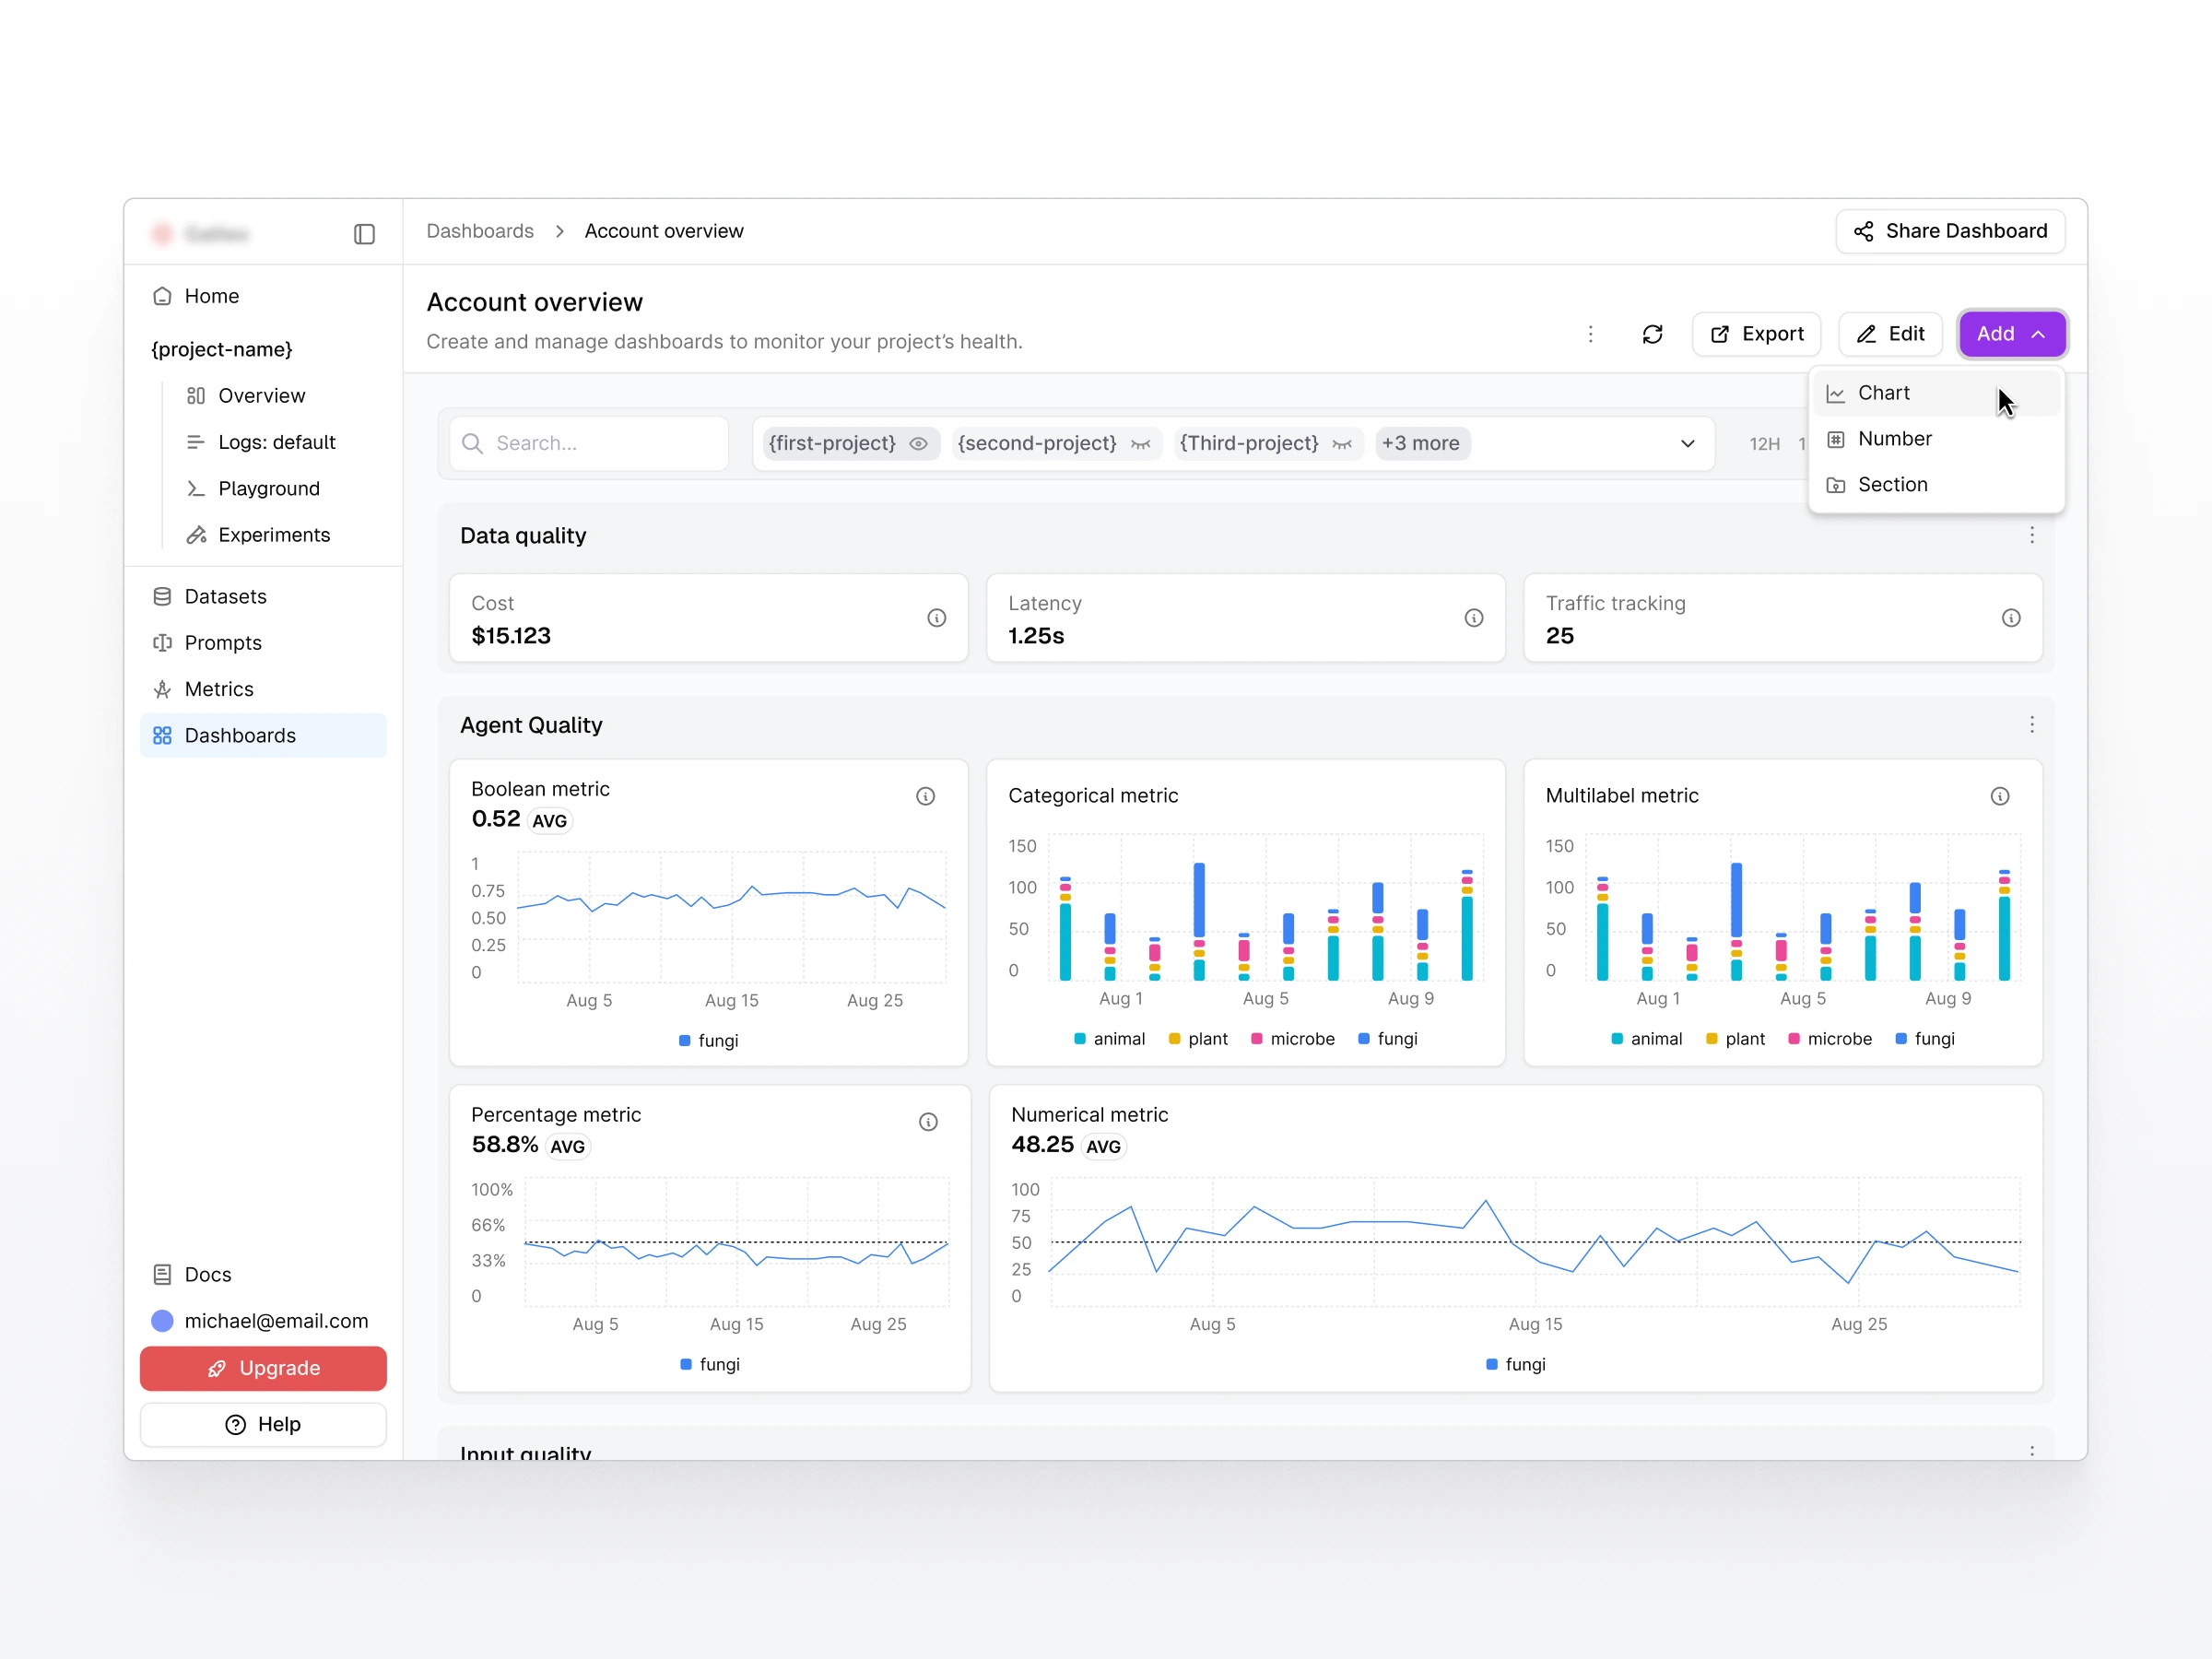
Dashboard view with an “Add” dropdown to quickly insert charts, metrics, or sections.
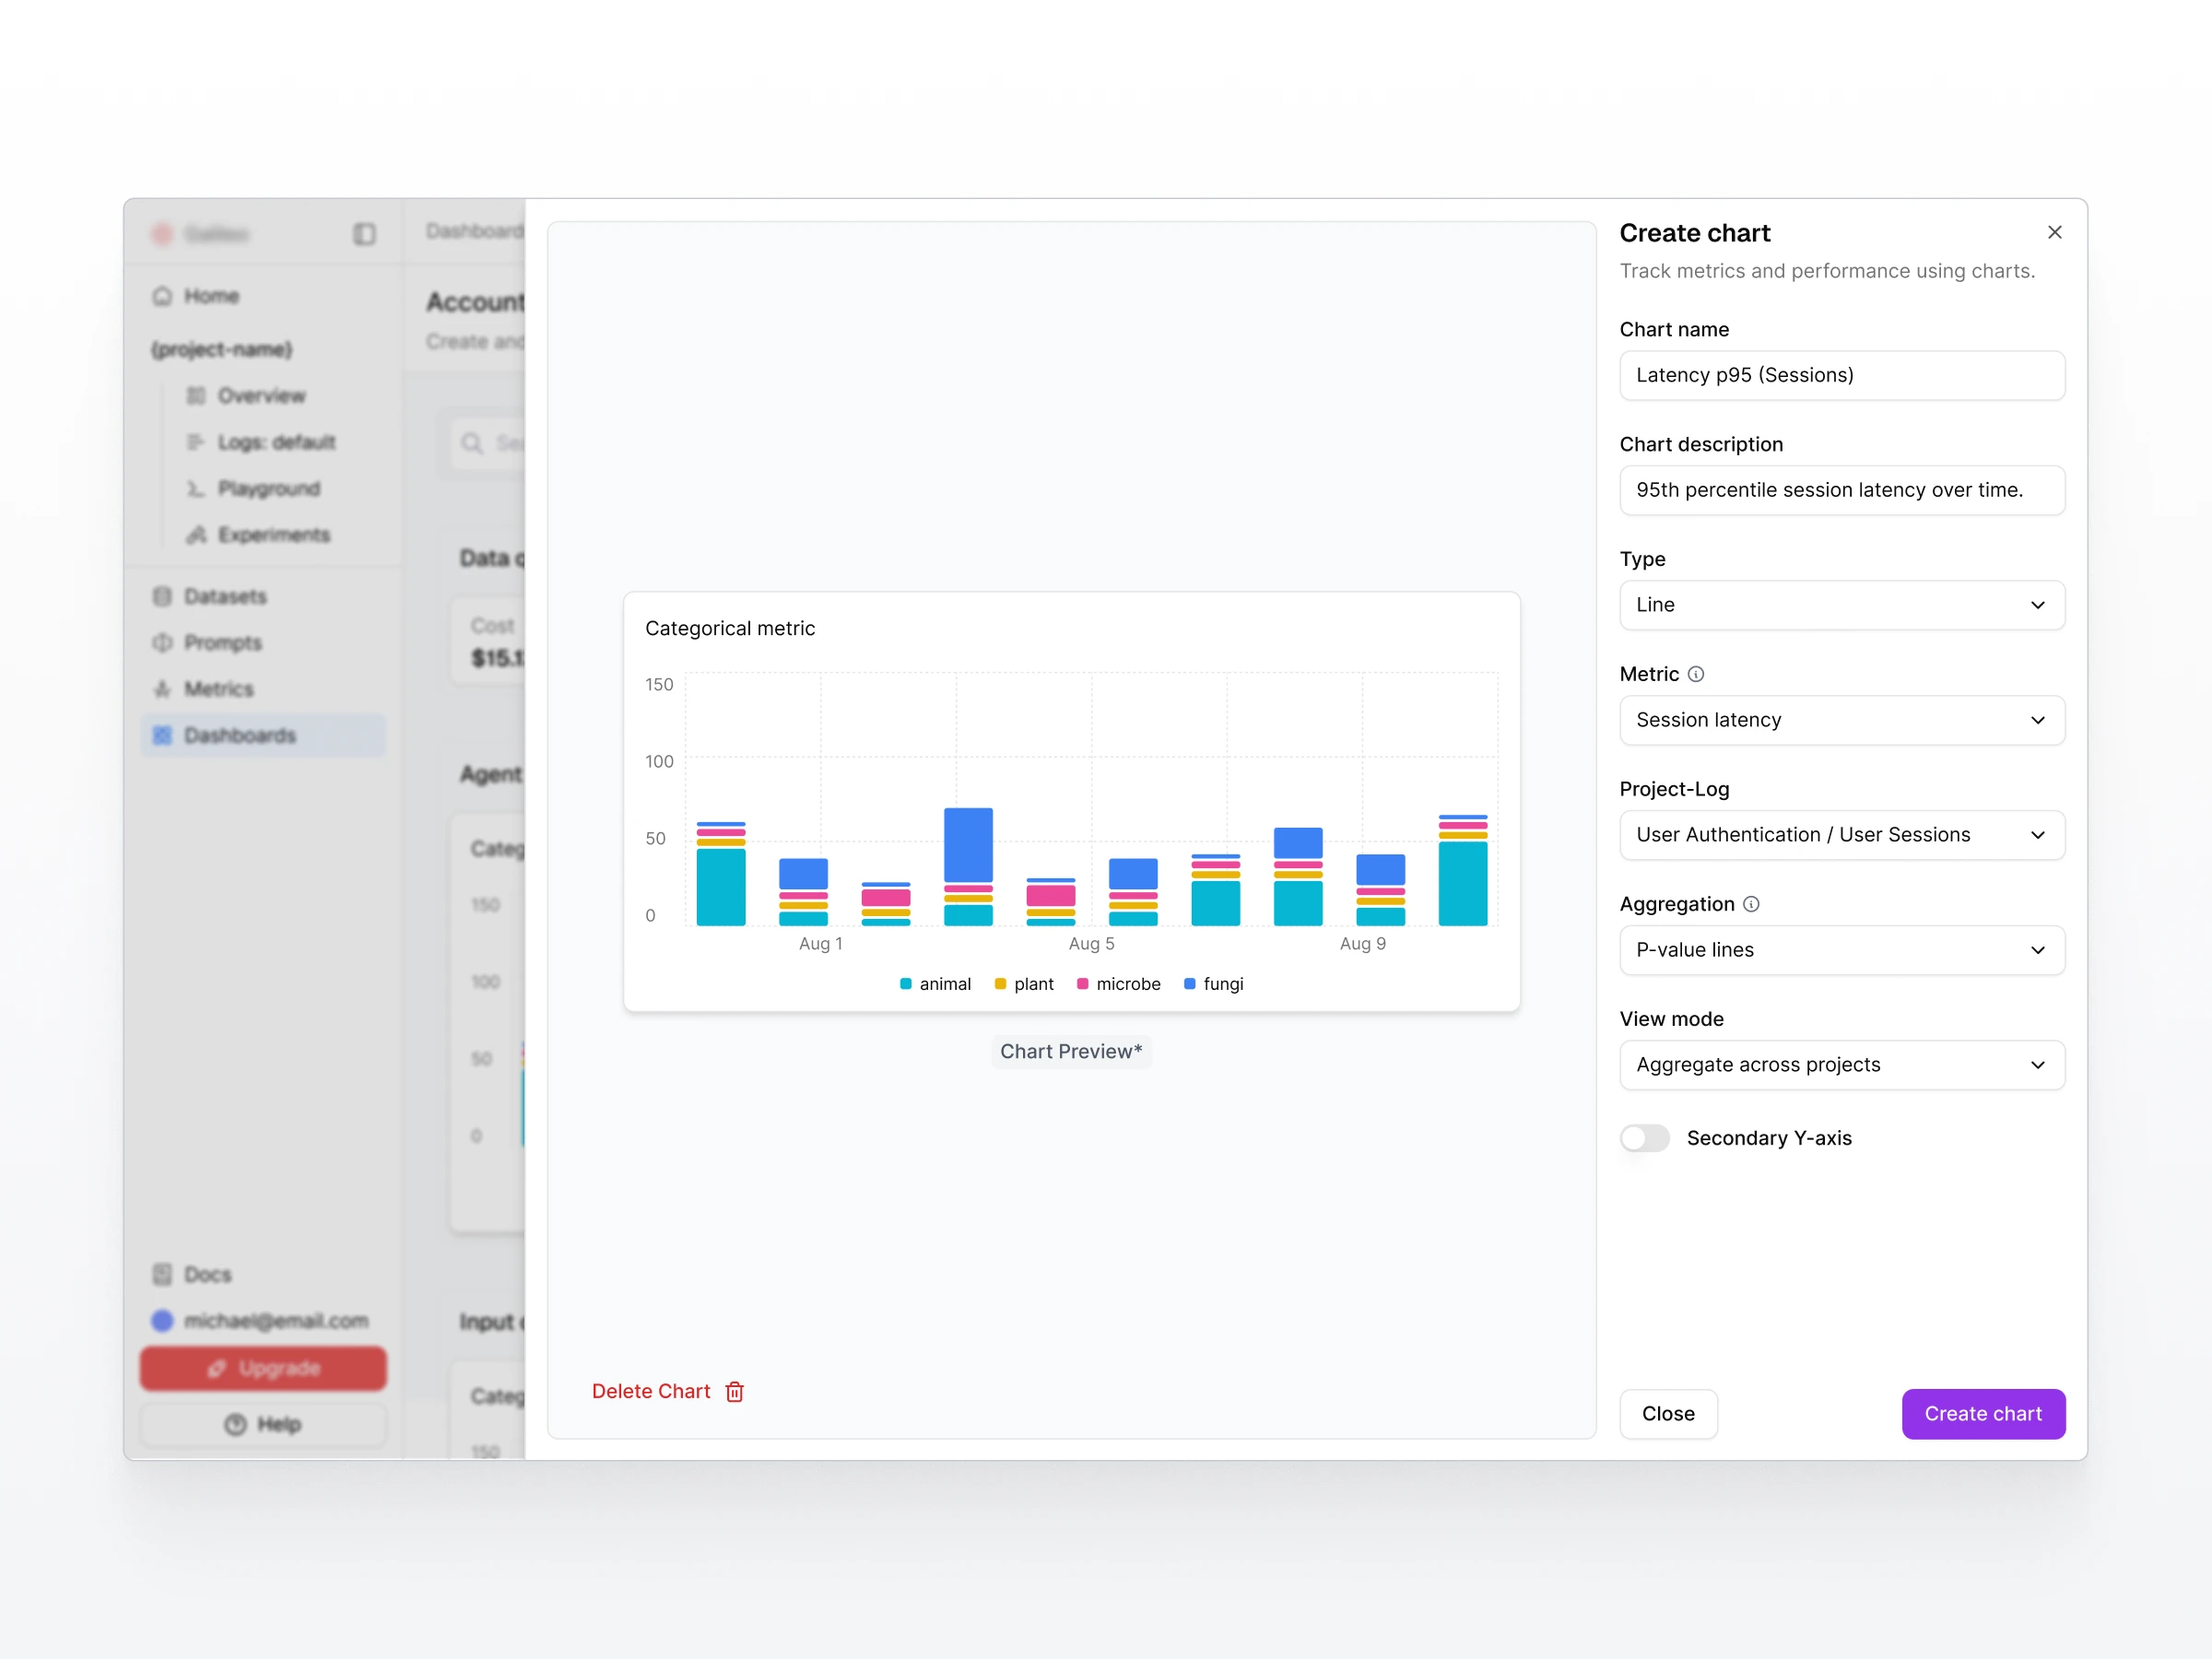
Drawer for configuring charts with metrics, settings, and live preview.
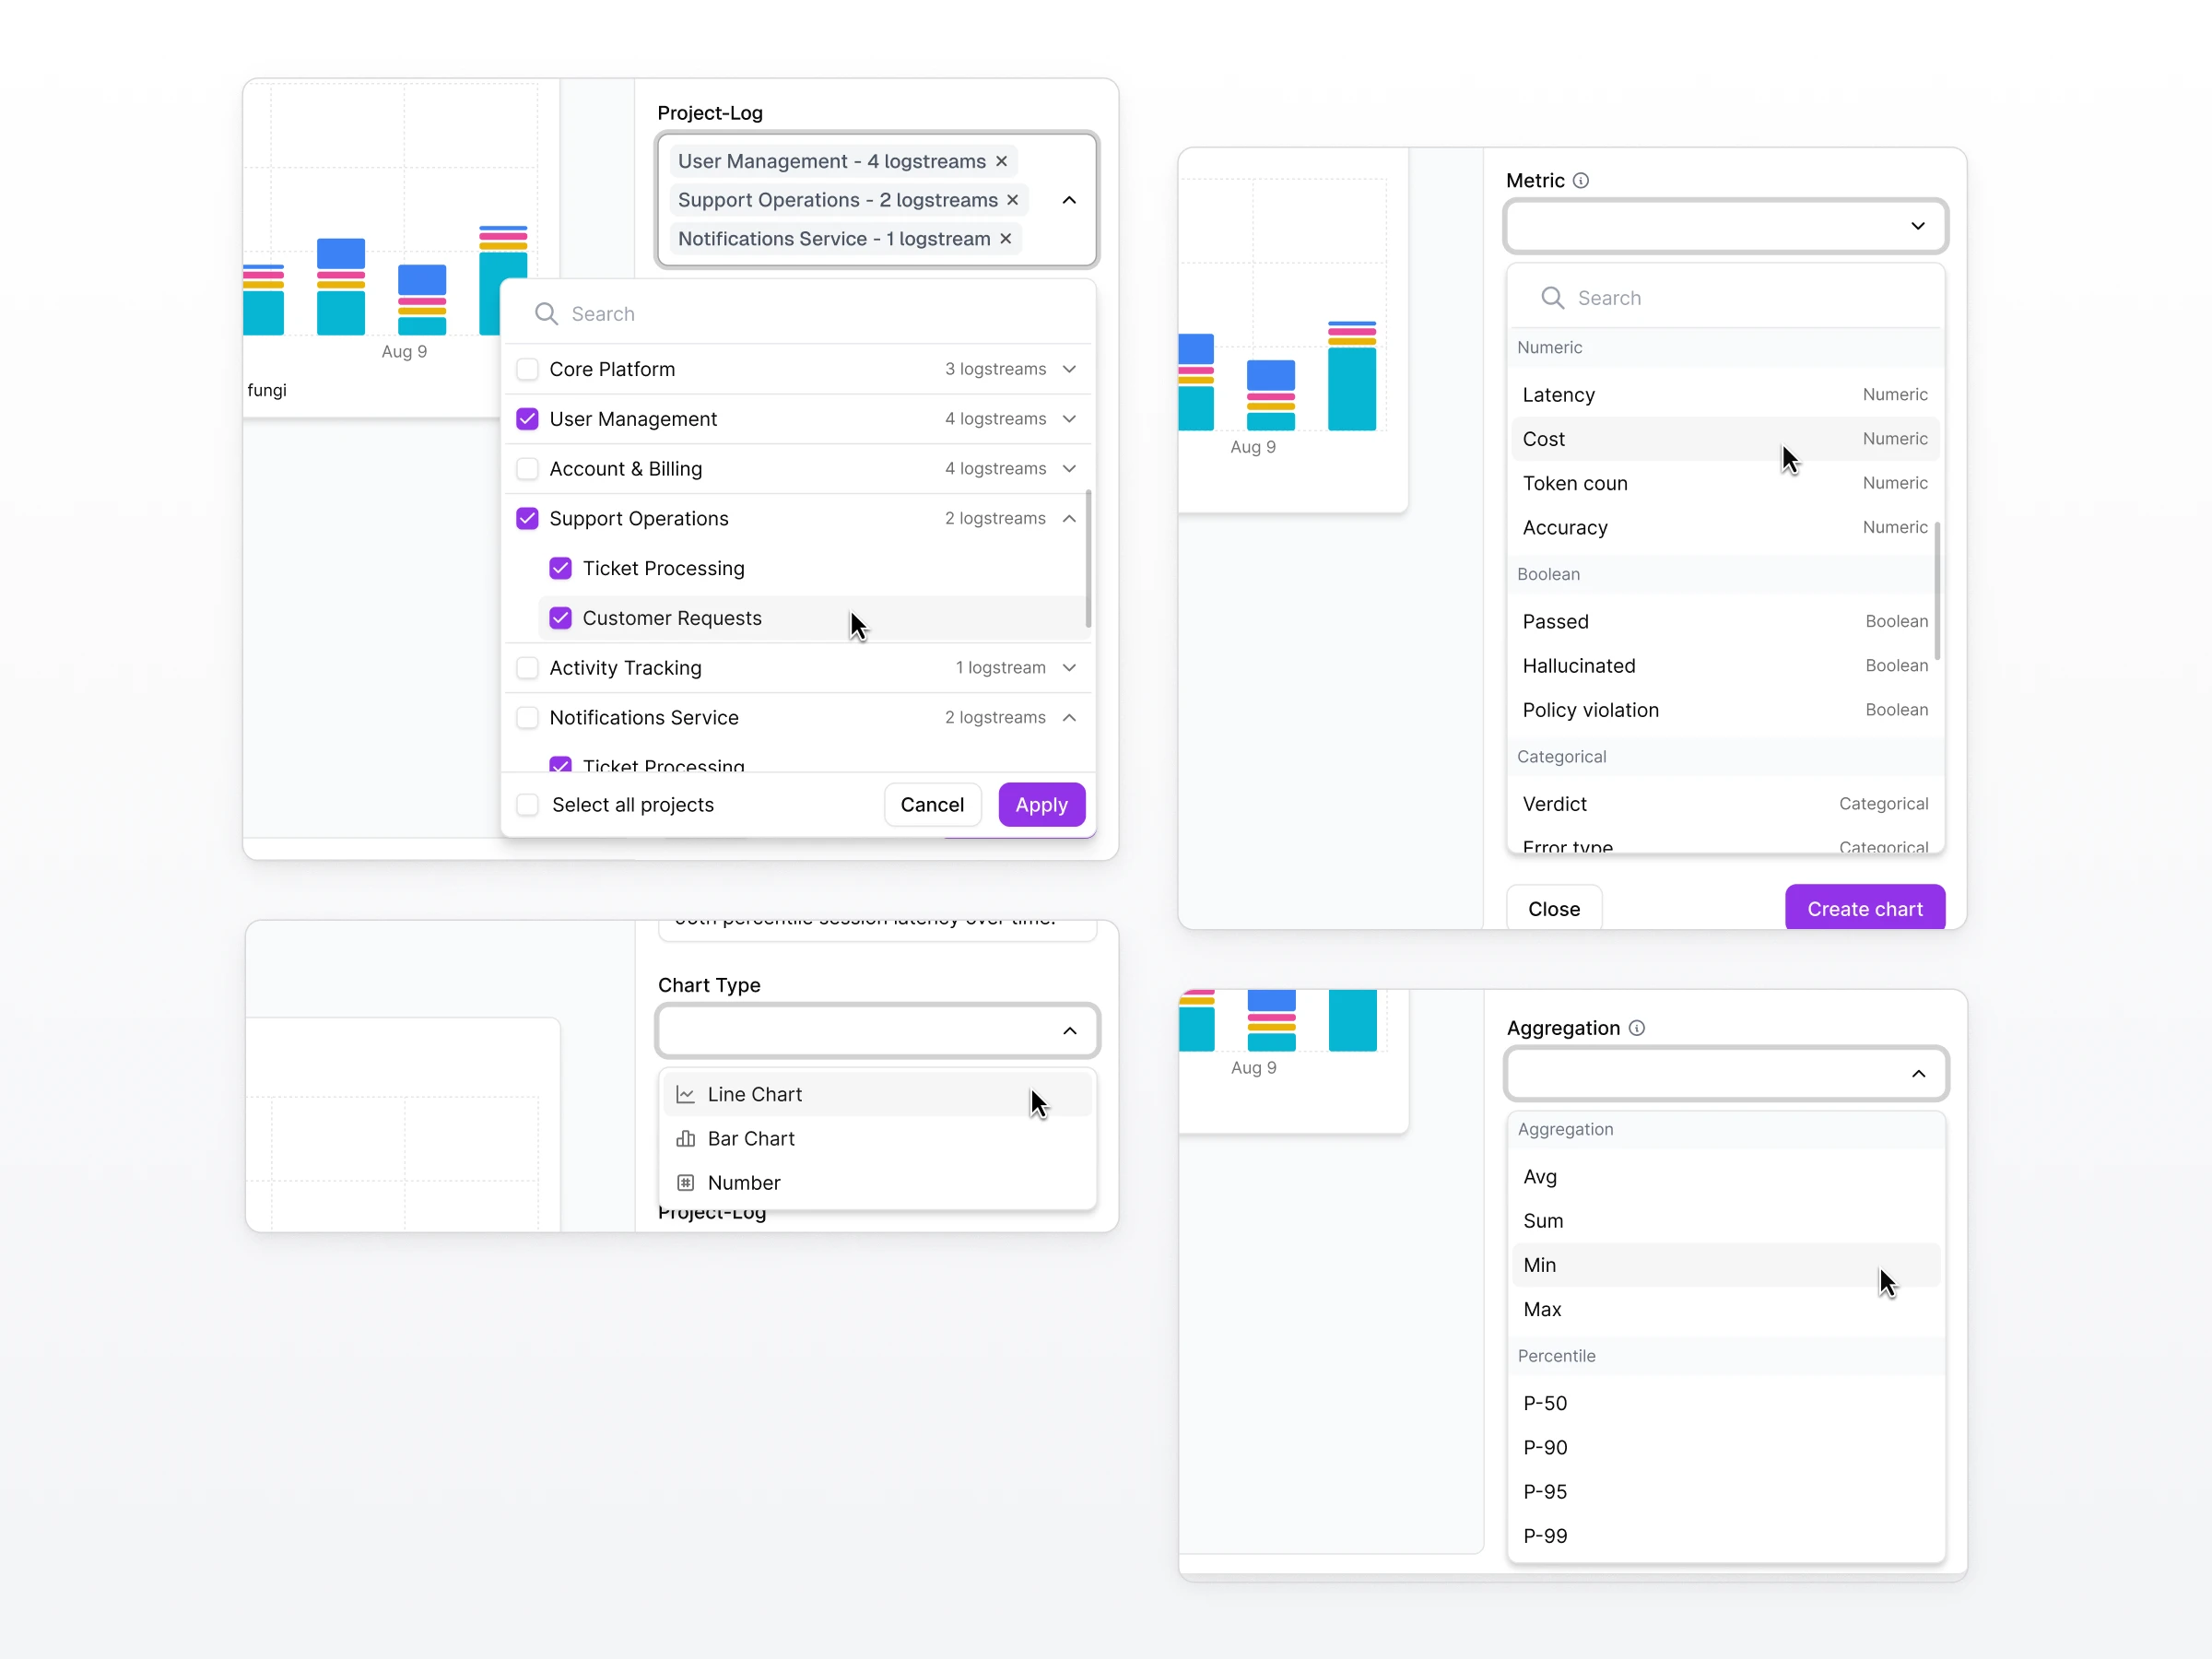
Different configuration states for selecting data sources, metrics, chart types, and aggregations.
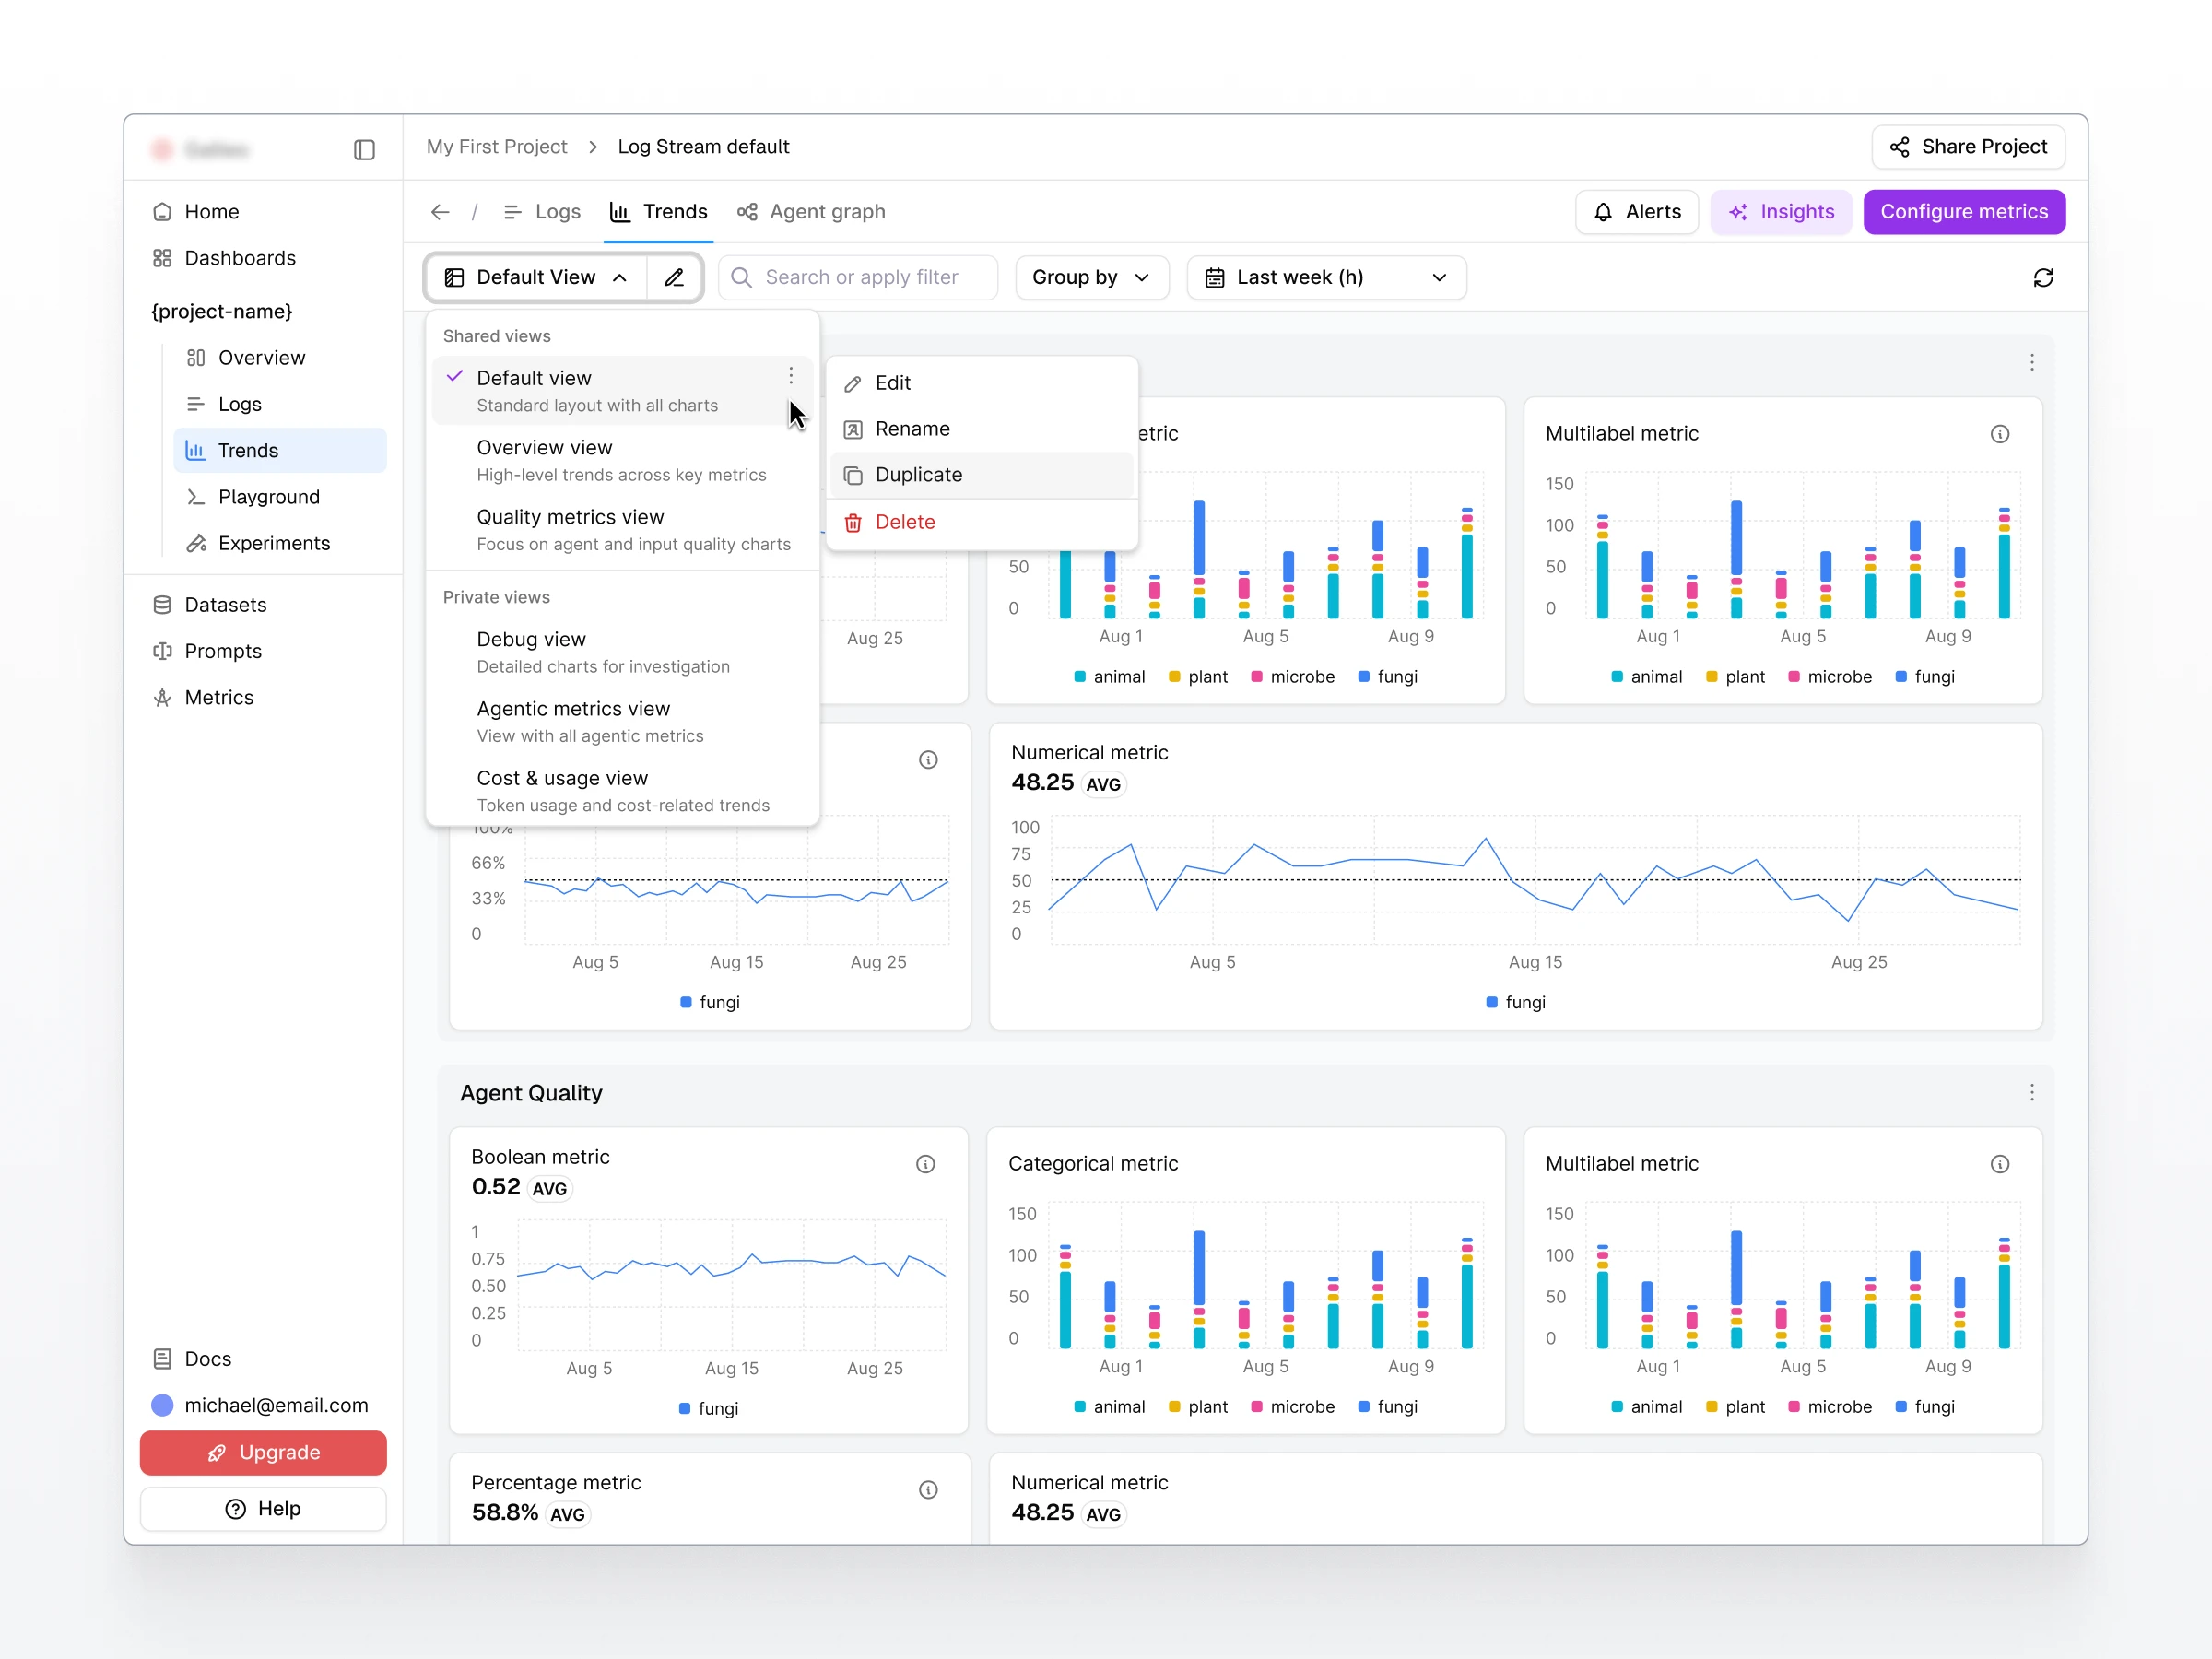
View switching across dashboards with layout management options.
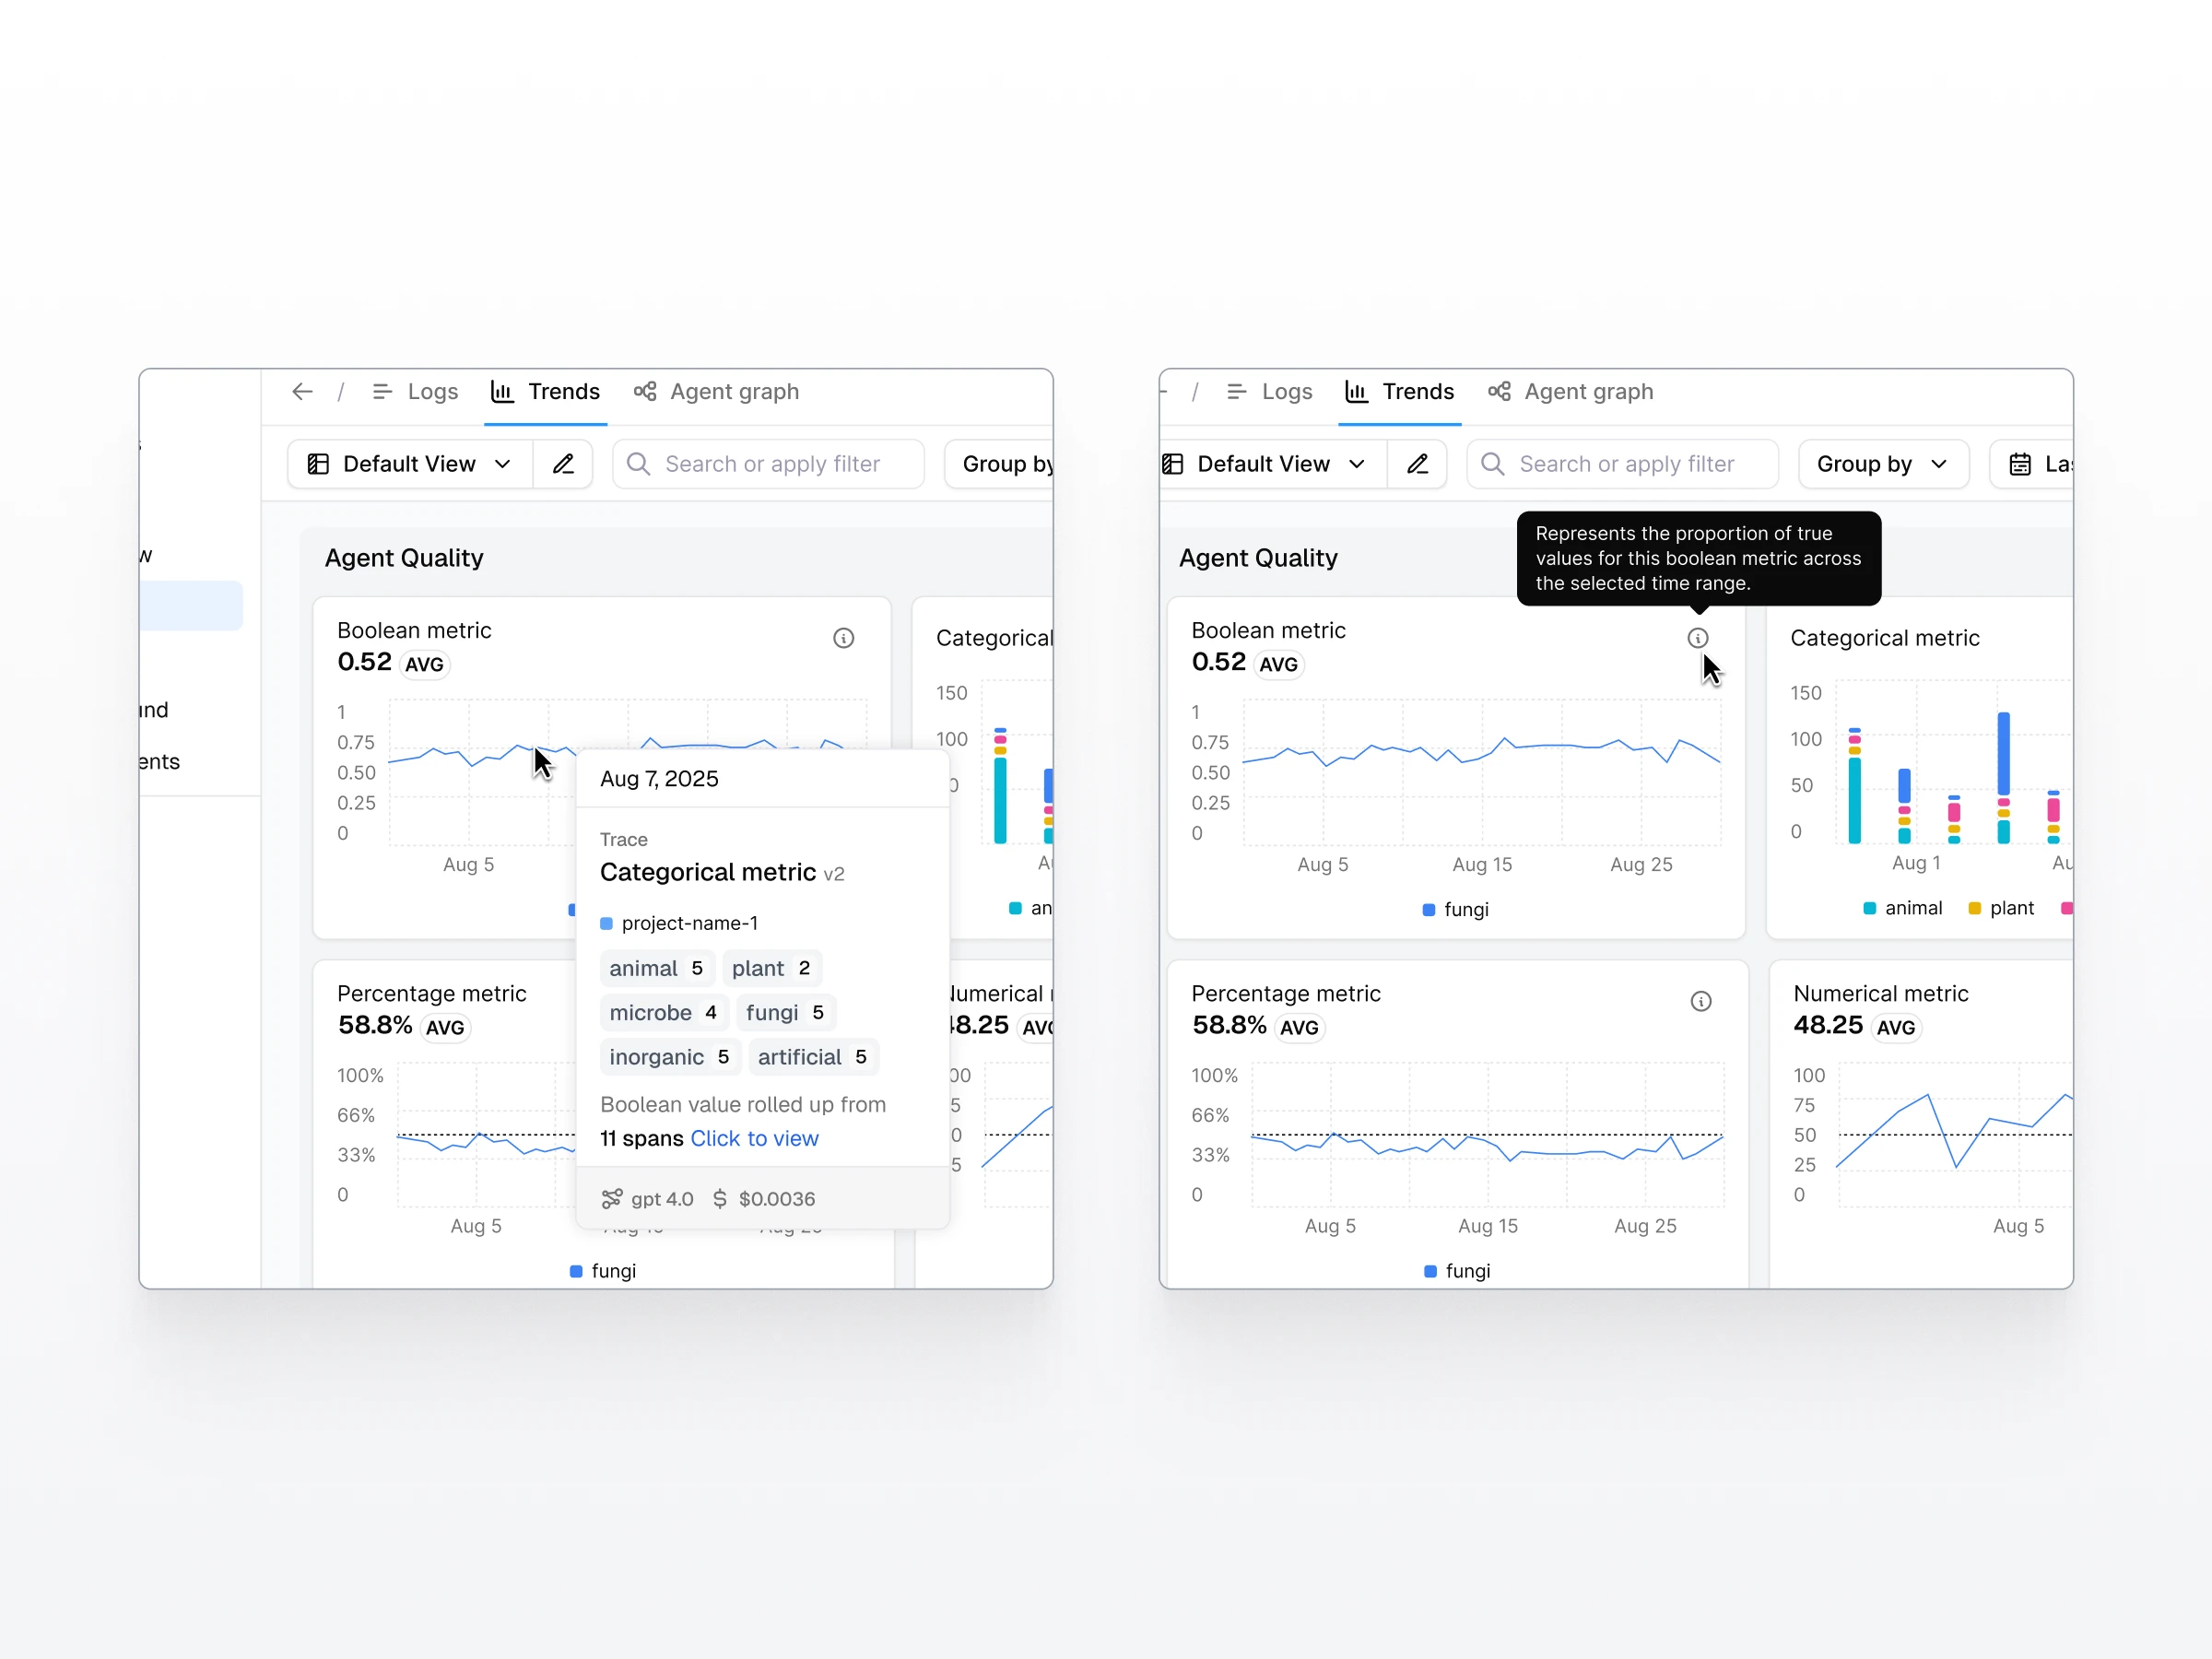
Chart hover states with detailed data insights.
0 likes · 6 views · Apr 11, 2026
Designed a customizable dashboard system for an AI platform.
