Superstore Profit & Discount Analysis

Maruffuzzman Tanvir


Superstore Profit & Discount Analysis
A SQL and Power BI portfolio project analyzing profitability drivers and the impact of discounting across a US retail superstore (2014–2017).
Tools: SQLite · DBeaver · Power BI · Excel
Dataset: Sample Superstore — 9,994 orders · 18 columns · 4 years
Business Question
"Which product categories and customer segments are driving the most profit, and where is discounting hurting margins?"
Dashboard Overview
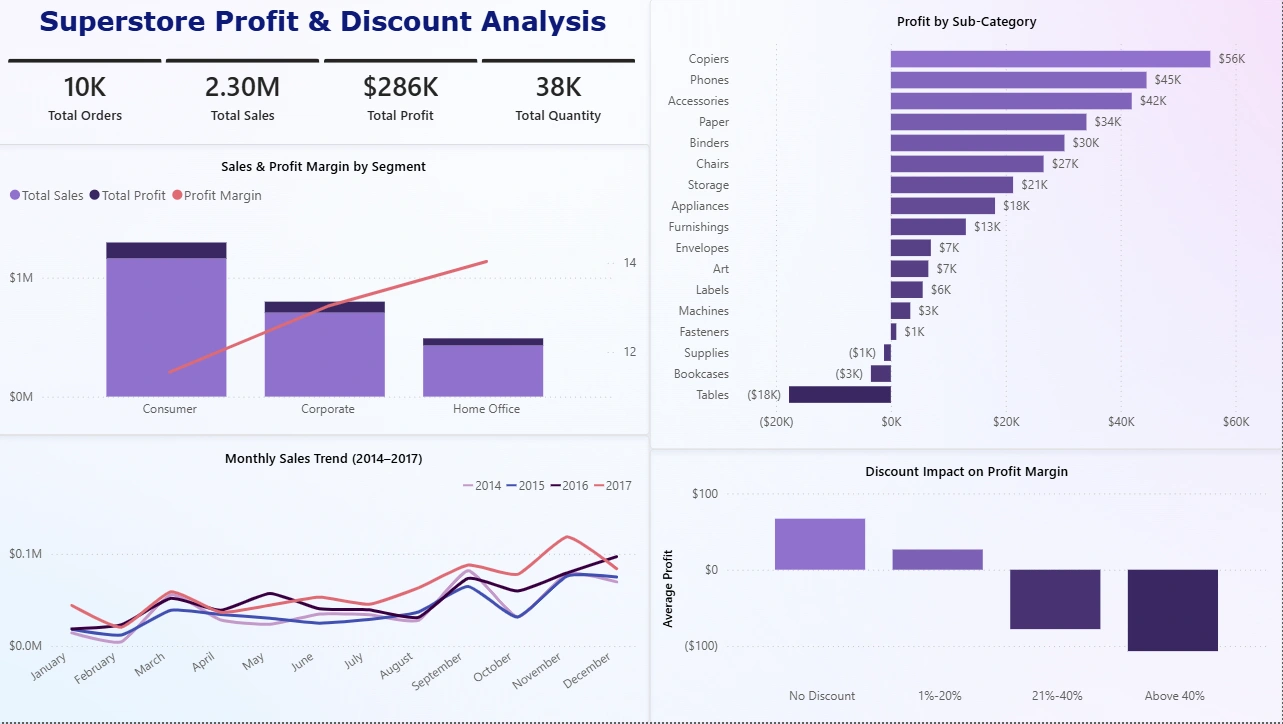
The dashboard presents four visuals and four KPI cards Total revenue stands at $2.30M with $286K total profit across 10K orders, reflecting an overall profit margin of 12.47%.
Analysis & Findings
1. Profit by Sub-Category
What I did: Aggregated total sales and total profit for all 17 sub-categories, sorted by profit to identify the best and worst performers.
What I found:
Technology dominates - Copiers ($55,617), Phones ($44,515), and Accessories ($41,936) are the top three profit drivers
Furniture is a problem - Tables (-$17,725) and Bookcases (-$3,472) are loss-making sub-categories despite significant sales volumes
Tables alone generate $206,965 in sales but produce a -8.56% profit margin, meaning the business loses money on every Table order on average
2. Sales & Profit Margin by Segment
What I did: Calculated total sales, total profit, and profit margin percentage for each of the three customer segments to identify which segment is the most efficient, not just the largest.
What I found:
Consumer generates the highest revenue ($1.16M) but has the lowest profit margin at 11.55%
Home Office generates the least revenue ($429K) but maintains the highest margin at 14.03%
The rising profit margin line against decreasing bar size tells the key story - volume and efficiency are inversely related across segments
Corporate sits in the middle at $706K revenue and 13.03% margin
3. Discount Impact on Profit Margin
What I did: Grouped all orders into four discount bands -- No Discount, 1–20%, 21–40%, and Above 40% -- and calculated the average profit per order for each band.
What I found:
No discount → average profit of $66.90 per order
1–20% discount → average profit drops to $26.50 per order
21–40% discount → average profit turns negative at -$77.86 per order
Above 40% discount → average profit reaches -$106.71 per order
933 orders (nearly 10% of all transactions) fall in the above 40% band
This is the strongest finding in the project — 20% is the clear profitability threshold
4. Top 5 & Bottom 5 Sub-Categories by Profit
What I did: Ranked all 17 sub-categories by total profit to isolate the five best and five worst performers, including profit margin percentage alongside absolute profit to distinguish low-volume from genuinely unprofitable sub-categories.
Top 5 Profit Drivers:
Sub-Category Total Sales Total Profit Margin % Copiers $149,528 $55,617 37.20% Phones $330,007 $44,515 13.49% Accessories $167,380 $41,936 25.05% Paper $78,479 $34,053 43.39% Binders $203,412 $30,221 14.86%
Bottom 5 Loss-Makers:
Sub-Category Total Sales Total Profit Margin % Tables $206,965 -$17,725 -8.56% Bookcases $114,880 -$3,472 -3.02% Supplies $46,673 -$1,189 -2.55% Fasteners $3,024 $949 31.40% Machines $189,238 $3,384 1.79%
5. Monthly Sales Trend (2014–2017)
What I did: Extracted year and month from the Order Date column and aggregated total sales per month across all four years to identify seasonal patterns and year-over-year growth.
What I found:
Sales show consistent year-over-year growth 2017 lines sit above 2016, which sit above 2015 and 2014
Q4 (October–December) is consistently the strongest period each year
Q1 (January–February) shows a recurring dip across all years
The seasonal pattern is predictable, the business should scale inventory and staffing ahead of Q4 and reduce costs in Q1
Recommendation
See
recommendation.md for the full findings, root cause analysis, and action recommendations.Repository Structure
superstore-profit-discount-analysis/
├── README.md
├── recommendation.md
├── queries/
│ └── sales_analysis.sql
├── dashboard/
│ └── superstore_dashboard.pbix
├── Image/
│ ├── Superstore Profit & Discount Analysis.png
│ ├── Profit by Sub-Category.png
│ ├── Sales & Profit Margin by Segment.png
│ ├── Discount Impact on Profit Margin.png
│ └── Monthly Sales Trend (2014–2017).png
└── data/
├── SampleSuperstore.csv
└── superstore_notes.md
SQL Queries
Five queries covering the full analysis -
queries/sales_analysis.sql:Profit by Category and Sub-Category
Sales vs Profit by Customer Segment
Discount Impact on Profit Margin
Top 5 and Bottom 5 Sub-Categories by Profit
Monthly Sales Trend (2014–2017)
Like this project
Posted Jun 29, 2026
Analyzed profitability and discount impact for a US retail superstore using SQL and Power BI.