The Leaky Bucket: Diagnosing SaaS Churn & Growth

Maruffuzzman Tanvir


The Leaky Bucket: Diagnosing SaaS Churn & Growth
A SQL + Power BI deep dive into a SaaS subscription business's MRR movement, retention, cohort behavior, customer value, and churn risk over a 37-month, 9,581-account history.
Thesis
Growth numbers alone don't tell you if a SaaS business is healthy, a company can add customers every month and still be losing ground if churn is draining revenue faster than new business fills it back in. This project uses 12 SQL questions across 5 categories to find out exactly where this business's growth was real, where it was masking a leak, and where the risk sits right now, how fast is revenue actually growing, how much of it survives, which cohorts and segments are driving the loss, and which currently active accounts look like the ones that already left.
The Analysis
Section 1: MRR Movement & Waterfall
The starting point, how much recurring revenue exists, and exactly where it's coming from and going to each month.
Q1. Monthly MRR & ARR
What I did:
Reconstructed each account's current MRR as of every month from the raw event ledger, since each row is a movement event, not a snapshot
Rolled up to total MRR and ARR per month, plus month-over-month growth rate
Major finding:
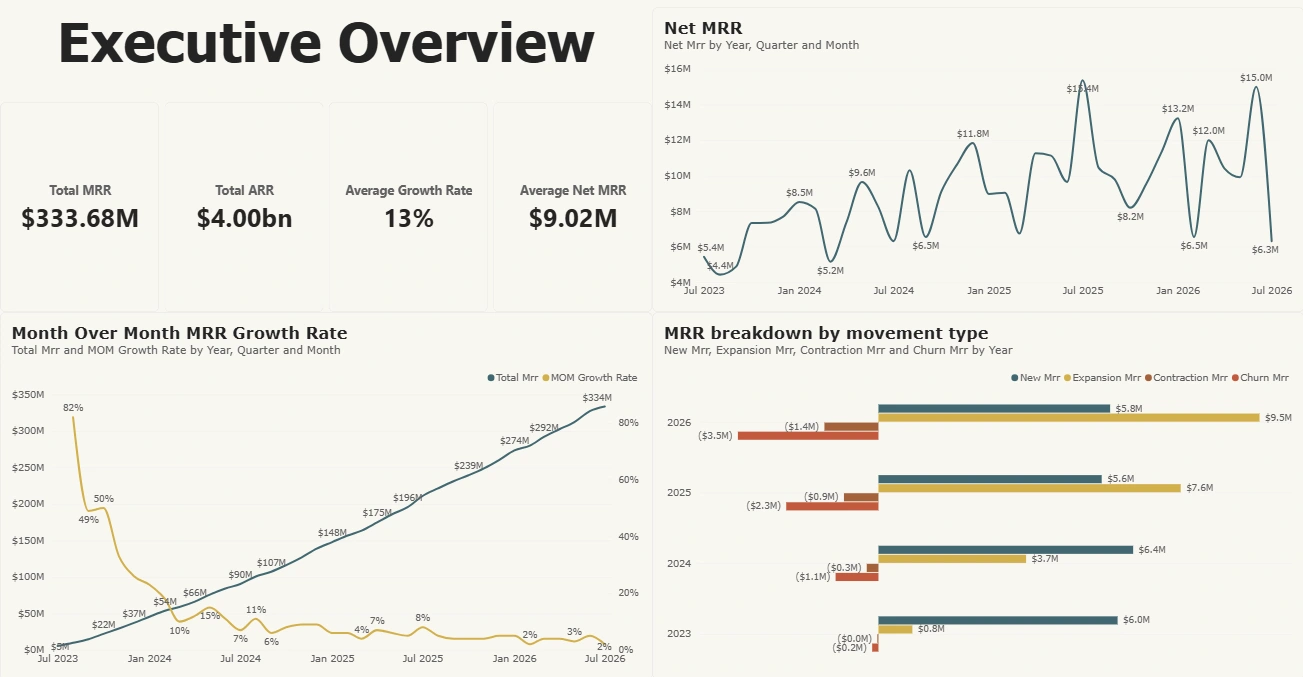
MRR grew from $5.43M to $333.68M across 37 months, roughly 61x, ending near $4.0B ARR
Q2. MRR by Movement Type
What I did:
Grouped monthly MRR deltas by movement type: new, expansion, contraction, churn to build the waterfall breakdown
No reactivation events exist in this dataset, so the waterfall is four-part rather than the usual five
Major finding:
$425.4M in gross additions vs. $91.7M in gross losses and churn alone accounts for 73% of everything lost
Q3. Net New MRR & Inflection Points
What I did:
Calculated net new MRR per month from the Q2 breakdown
Ranked months by swing size to flag the strongest and weakest periods
Major finding:
No month in the entire dataset went negative every single month grew net-net, just at very different speeds
Section 2: Retention
Growth means nothing if it isn't kept. This section isolates how much revenue survives on its own, separate from new business.
Q4. Gross Revenue Retention (GRR)
What I did:
Isolated the cohort of accounts active at the start of each month
Calculated the % of their revenue kept, excluding new accounts and expansion entirely
Major finding:
GRR holds in a 90–98% band across the full period, averaging 94.2% stable, not declining
Q5. Net Revenue Retention (NRR)
What I did:
Repeated the GRR calculation, this time adding back expansion revenue from the same existing-account base
Major finding:
NRR beats 100% in 35 of 36 months, averaging ~108% expansion consistently outpaces what's lost to churn and downgrades
Section 3: Cohort Retention
Retention averages hide a lot. This section tracks individual signup cohorts over time to see whether that pattern holds, and where it breaks.
Q6. Logo Retention by Cohort
What I did:
Grouped accounts by signup month and tracked what % of the original cohort was still active at 1, 3, 6, and 12 months out
Major finding:
Month-1 retention sits at 92-100%, but the steepest drop happens between month-1 and month-3 churn risk is heavily front-loaded, not a slow long-term fade
Q7. Revenue Retention by Cohort
What I did:
Repeated the cohort tracking, this time following revenue instead of headcount, letting values exceed 100% where expansion outweighs churn
Major finding:
Every mature cohort's month-12 revenue sits above 100% of where it started, ranging 122-187% the accounts that stay expand enough to cover the third that leave
Q8. Best vs. Worst Cohort
What I did:
Ranked cohorts by month-12 revenue retention, then broke down the top and bottom cohort's account mix by plan, region, and industry
Major finding:
The best and worst cohorts had nearly identical logo retention the 65-point NRR gap between them came down to how concentrated their revenue was in a handful of large accounts, not who stayed
Section 4: LTV & Efficiency
Not every customer is worth the same. This section puts a dollar figure on retention and checks whether growth is still efficient as the business scales.
Q9. Average LTV by Plan
What I did:
Calculated lifetime value per plan tier using MRR divided by that tier's churn rate, since no margin data exists to build a cost-based LTV
Major finding:
Enterprise LTV ($14.33M) outweighs Starter ($3,369) by roughly 4,250x losing one Enterprise account costs as much lifetime value as losing hundreds of Starter accounts
Q10. Quick Ratio
What I did:
Calculated (new + expansion MRR) ÷ (contraction + churned MRR) per month to measure growth efficiency over time
Major finding:
The ratio has never dropped below 1.0, but declined from the 50s early on to a 2-5x range recently a sign of a maturing base, not a warning sign
Section 5: Segmentation & Risk
Where exactly is the leak, and who's at risk of adding to it right now?
Q11. Churn Rate by Segment
What I did:
Calculated churn rate across every plan, region, and industry combination, then rolled up to single dimensions to compare their explanatory power
Major finding:
Plan tier explains a 24-point churn spread; region and industry each explain under 3 points the leak is the Starter tier specifically, not any one region or industry
Q12. At-Risk Watchlist
What I did:
Defined a risk profile from historically high-churn segment combinations, then filtered currently active accounts matching that profile, ranked by MRR
Major finding:
1,948 active accounts about 20% of the base carry $3.1M in at-risk MRR, with the top 10 highest-value accounts all sharing the same combo: Business / North America / Fintech
Full Findings
The summary above only covers the headline finding for each question. For the complete breakdown, including secondary numbers and caveats not shown here, see
insight.md.SQL Queries
All 12 questions are written as standalone
.sql files, grouped into 5 section files. Full logic and inline comments are documented directly in the files.📁
sql_queries/Power BI Dashboard
A 5-page interactive report with custom page navigation and diverging color scales on the cohort retention heatmaps.
📊
powerBi_dashboard/Data
Built on a synthetic SaaS MRR ledger (mockdatafaker.com). See
data/datanote.md for assumptions, known data quirks, and how they were handled.📁
data/Project Structure
Tech Stack
SQL Server · DBeaver · Power BI · ExcelConnect
Like this project
Posted Sep 7, 2026
Diagnosing SaaS churn and growth health with SQL and Power BI - MRR waterfall, GRR/NRR, cohort retention, and an at-risk customer watchlist.
Likes
0
Views
4
Timeline
Aug 17, 2026 - Sep 6, 2026