F1 Championship Metric Comparison: Vettel vs Verstappen

Maruffuzzman Tanvir


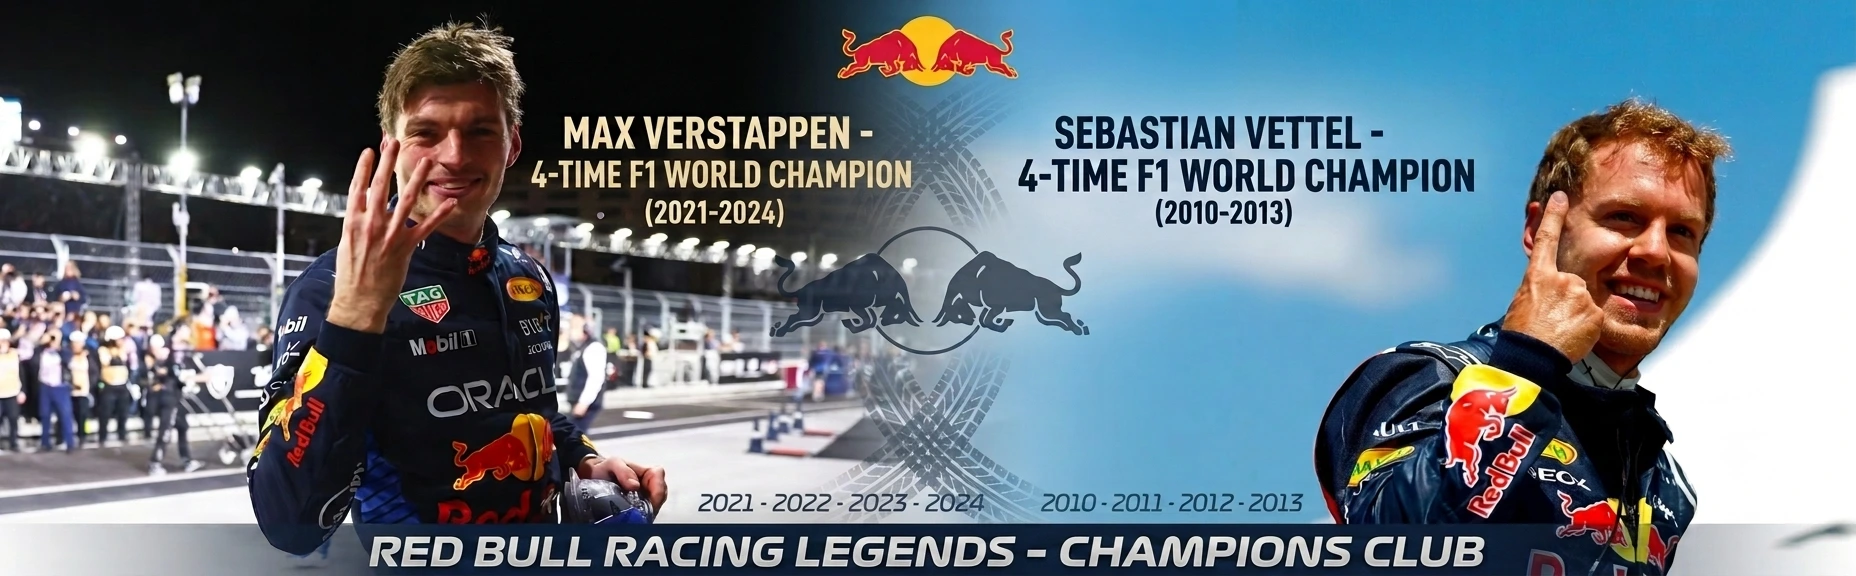
Four-Time Champions: Vettel vs Verstappen
A SQL + Power BI deep dive comparing Sebastian Vettel's (2010-2013) and Max Verstappen's (2021-2024) four-title peaks at Red Bull Racing, race by race, season by season, metric by metric.
Thesis
Two drivers, two eras, the same team, both won four straight titles with Red Bull Racing, but they won them in very different ways. This project uses 14 SQL questions across 5 categories to find out exactly where their peaks matched, and where they didn't: who was more dominant, who was more efficient, who handled pressure better, and who had the bigger edge over their own teammate.
The Analysis
Section 1: Scale of Dominance
How large was each driver's championship advantage in points converted, margins won by, and how early the title was sealed?
Q1. Points Efficiency Across Four Championship Seasons
What I did:
Combined race and sprint points (
UNION ALL) for Verstappen's sprint-era seasonsCalculated each season's maximum possible points using a flat per-race rate (25 / 29 / 34 by era)
Measured % of available points actually converted, per season and career average
Major finding:
Vettel converted a higher share of available points on average 69.05% vs Verstappen's 63.28%, despite winning fewer races overall
Q2. Championship Winning Margin Per Season
What I did:
Pulled final-round standings for the top 2 finishers each season
Calculated the points gap and that gap as a % of the champion's total points
Major finding:
Verstappen's tightest title (2021, 2%) and widest (2023, 50.4%) bookend the entire dataset, the single largest swing of any driver
Q3. How Early Did They Clinch Each Title?
What I did:
Built a round-by-round CTE comparing the champion's cumulative points against the 2nd-place driver's maximum catchable points (flat rate)
Flagged the first round where the title became mathematically unreachable for anyone else
Major finding:
Verstappen's earliest clinch (2023) came with 5 races still to run, the most cushion either driver had in any title year
Section 2: How They Won
Beyond just winning, how did each driver actually get there? Pole conversion, grid recovery, and reliability all shape the picture.
Q4. Win Rate, Pole Rate, and Podium Rate
What I did:
Combined results and qualifying data to compute win, podium, and pole ratios per season
Averaged each ratio across each driver's four-year peak
Major finding:
Verstappen's average win rate (59.4%) clears Vettel's (44.4%) by the largest single margin in the whole project
Q5. Grid vs Finish Position, and Win Distribution by Starting Grid
What I did:
Compared average grid vs average finish position per season (Part A)
Bucketed every win by starting grid position- pole, 2-5, or 5+ to see how often wins came from outside the front row (Part B)
Major finding:
Verstappen won from outside the top 5 on the grid in 3 of his 4 seasons something Vettel never did in his four titles
Q6. DNF Rate and Causes
What I did:
Cross-referenced actual status text values (not assumed categories) to split DNFs into mechanical vs incident causes
Calculated DNF/completion ratios and estimated points lost per season
Major finding:
Verstappen's 2023 was flawless zero DNFs, a 100% completion rate, the cleanest season either driver had
Section 3: Consistency & Pressure
Titles aren't just won on best days - they're won by minimizing bad ones. This section looks at scoring consistency and how each driver performed when the title was actually on the line.
Q7. Race-by-Race Points Consistency
What I did:
Calculated standard deviation, minimum, and maximum points scored per race within each championship season
Used this to measure how predictable each driver's scoring was
Major finding:
Verstappen's 2023 was the most consistent season of either driver, a standard deviation of just 3.78 points, never scoring fewer than 10
Q8. Cumulative Points Progression (Champion vs Rival)
What I did:
Locked the "champion" identity using their final-round standing, avoiding mid-season identity flips
Tracked their round-by-round points gap against whichever non-champion driver was the strongest rival at that specific round
Major finding:
Vettel trailed the championship rival for 18 of 19 races in 2010, only taking the lead in the final race in Abu Dhabi one of the closest come-from-behind titles in F1 history
Q9. Performance in Must-Win Pressure Races
What I did:
Defined a "pressure race" as one of the final 5 rounds with a points gap of ≤50 entering that round, calculated via
LAG()Compared each driver's performance in those races against their full-season average
Major finding:
Every pressure season for both drivers shows a positive delta both drivers scored above their season average when the title was actually on the line
Section 4: Teammate Benchmark
The most controlled comparison possible: same car, same team, same season. How much of an edge did each driver have over the person sitting in the identical machinery?
Q10. Qualifying Head-to-Head vs Teammate
What I did:
Parsed and converted raw qualifying time strings into milliseconds via string-splitting and
CROSS APPLYCompared champion vs teammate lap times race by race
Major finding:
Verstappen's best single-lap qualifying gap over a teammate was −3700 ms (2022) the largest outright edge either driver posted
Q11. Race Head-to-Head vs Teammate
What I did:
Compared finish positions between champion and teammate across races where both were officially classified as "Finished"
Tracked ahead/behind ratio and average positional gap
Major finding:
Verstappen finished ahead of his teammate in 100% of classified races in two separate seasons (2021, 2024)
Q12. Points Gap Over Teammate at Season End
What I did:
Pulled season-end cumulative points for champion vs teammate
Calculated the raw points gap, gap ratio, and running career totals for both drivers using a window function
Major finding:
Verstappen's 2023 produced the largest teammate points gap of either driver by a wide margin - 290 points
Section 5: The Peak Compared
This section doesn't introduce new metrics, it restructures everything from Sections 1-4 into two final comparison formats.
Q13. Season-by-Season Comparison via Positional Year in Streak
What I did:
Re-aligned both drivers' seasons by year in streak (Year 1 vs Year 1, Year 2 vs Year 2...) instead of calendar year
Joined all 9 prior views into one row per season for a fair side-by-side
Q14. The Complete Scorecard
What I did:
Aggregated all 9 views into a single career-level scorecard one row per metric, Vettel and Verstappen side by side
Built as this project's single "screenshot moment"
Full Findings
The summary above only covers the headline finding for each question. For the complete, detailed breakdown of every question, including secondary numbers and notable patterns not shown here, see
insight.md.SQL Queries
All 14 questions are written as standalone
.sql files, one per section, built on CTEs and 9 reusable views. Full logic, inline methodology notes, and known caveats are documented directly in the files.📁
sql_queries/Power BI Dashboard
A 5-page interactive report built in Red Bull Racing livery colors (navy/red/amber), with custom page navigation.
📊
powerBi_dashboard/Data
Built on the Ergast F1 Database (via Kaggle). Raw table import required a cleaning fix before it would load correctly, see
datanote.md for what happened and how it was handled.📁
data/Project Structure
Tech Stack
SQL Server · DBeaver · Power BI · ExcelConnect
Like this project
Posted Jul 18, 2026
SQL and Power BI analysis comparing Vettel’s and Verstappen’s F1 title reigns.
Likes
0
Views
12
Timeline
Jan 1, 2021 - Dec 31, 2024
Clients
Red Bull Racing