SaaS Social Media Quarterly KPI Dashboard Development
Damian Moore
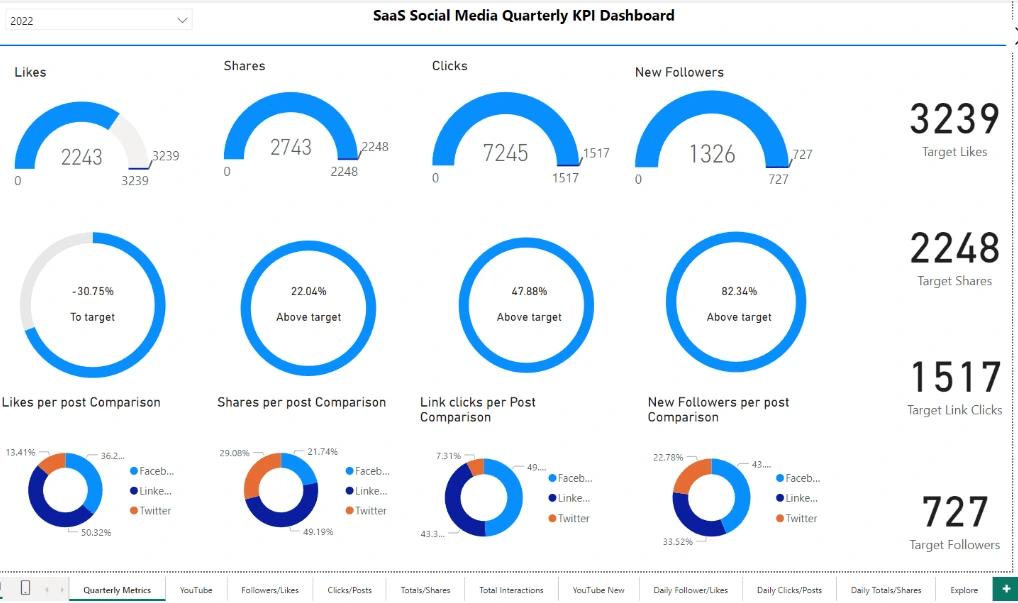
Project description. This dashboard was created to track and visualize key performance indicators (KPIs) for social media engagement. The dashboard provides insights into likes, shares, clicks, and new followers across various social media platforms, including Facebook, LinkedIn, and Twitter. It allows the company to monitor their performance against predefined targets, compare metrics per post, and analyze the distribution of interactions across different social channels. The dashboard includes various visual elements such as gauges, comparison charts, and pie charts to facilitate easy interpretation of data.
Like this project
Posted May 31, 2024
This dashboard was created to track and visualize key performance indicators (KPIs) for social media engagement.