Salesforce-Data-Analysis-Project
Damian Moore
Salesforce-Data-Analysis-Project
A Data Analysis project analyzing Salesforce data
Project Overview
The Salesforce Data Analysis Project aims to analyze Salesforce data to gain insights into data quality, future projections for 2024, and strategies to increase revenue. The analysis was performed exclusively using Excel.
Data Source
Salesforce Revenue Data
Tools
Project done exclusively within microsoft excel
Data Cleaning/ Preparation
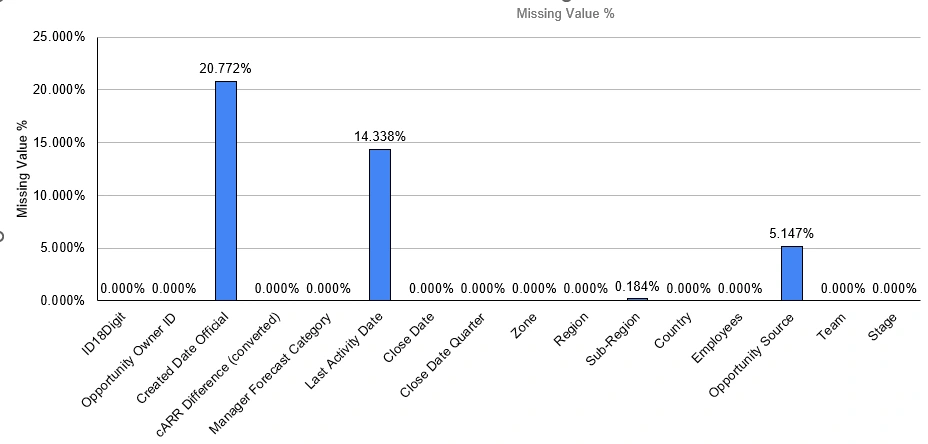
Based on the data, the overall data quality is fairly clean. However, there are several data points that need attention. Specifically, some columns have over 10% of their data missing, which affects the overall data quality.
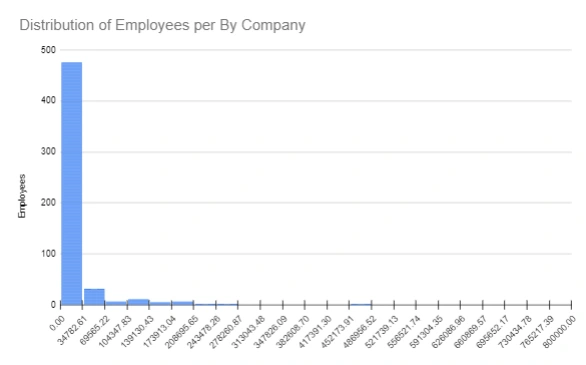
Additionally, there is a significant distribution of companies with fewer than 30,000 employees, alongside some companies with significantly higher employee counts. This disparity suggests the presence of outliers that could potentially skew the analysis.
In summary, while the dataset is generally clean, the following issues should be addressed to improve data quality:
Missing Values: Some columns have more than 10% missing data, which impacts the integrity of the dataset. Imputing or removing these missing values is necessary. Outliers: The Employees column shows a heavy concentration of companies with less than 30,000 employees, but there are a few companies with much higher counts. These outliers need to be reviewed to ensure they do not distort the analysis. By addressing these issues, the dataset can be made more robust, leading to more accurate and reliable insights.right skewed by outliers.
Explaratory Data Analysis
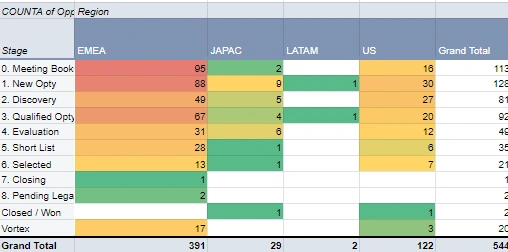
Analyzing the heatmap, it appears that there may be missing data, and many opportunities do not progress to the later stages of closing.
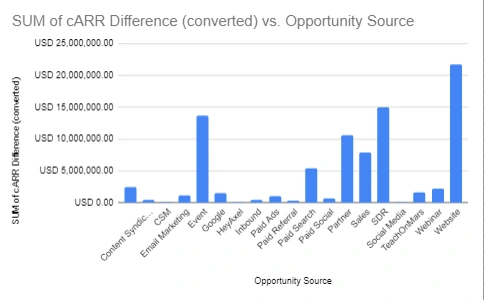
Identifying Revenue against the Opportunity Source highlights which Oppurtunities produced the most revenue. Base on this analysis the website, SDR, Event, and already identified Partners produced the most revenue
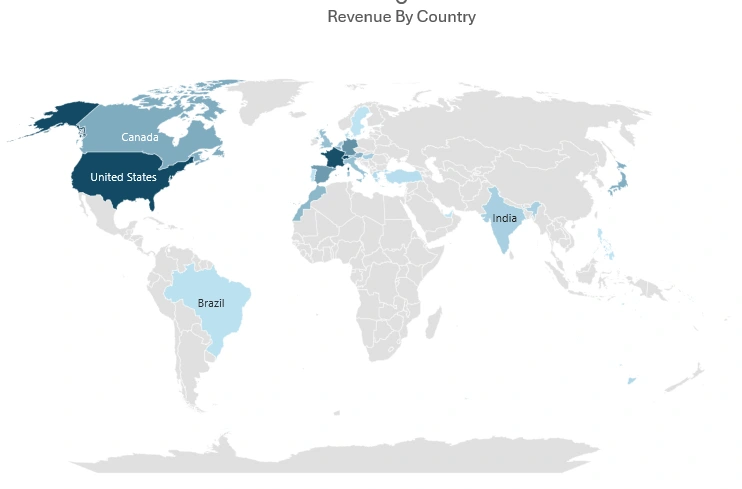
This visual identifies the revenue based on The Country, the darker the country the more revenue generated by the country.
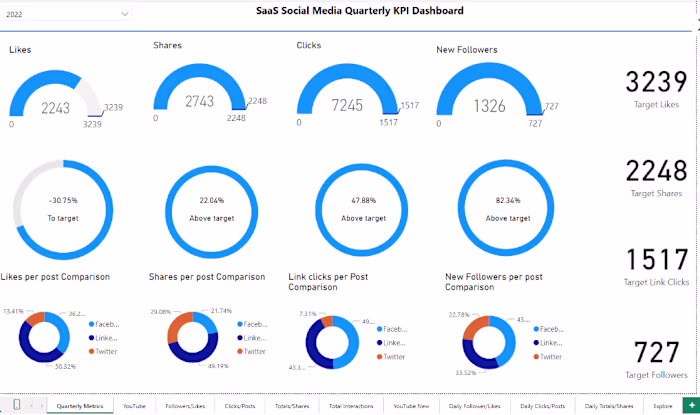
Dashboard Creation
Creatd a dashboard exclusively via excel to highlight a product that will aid in the analysis
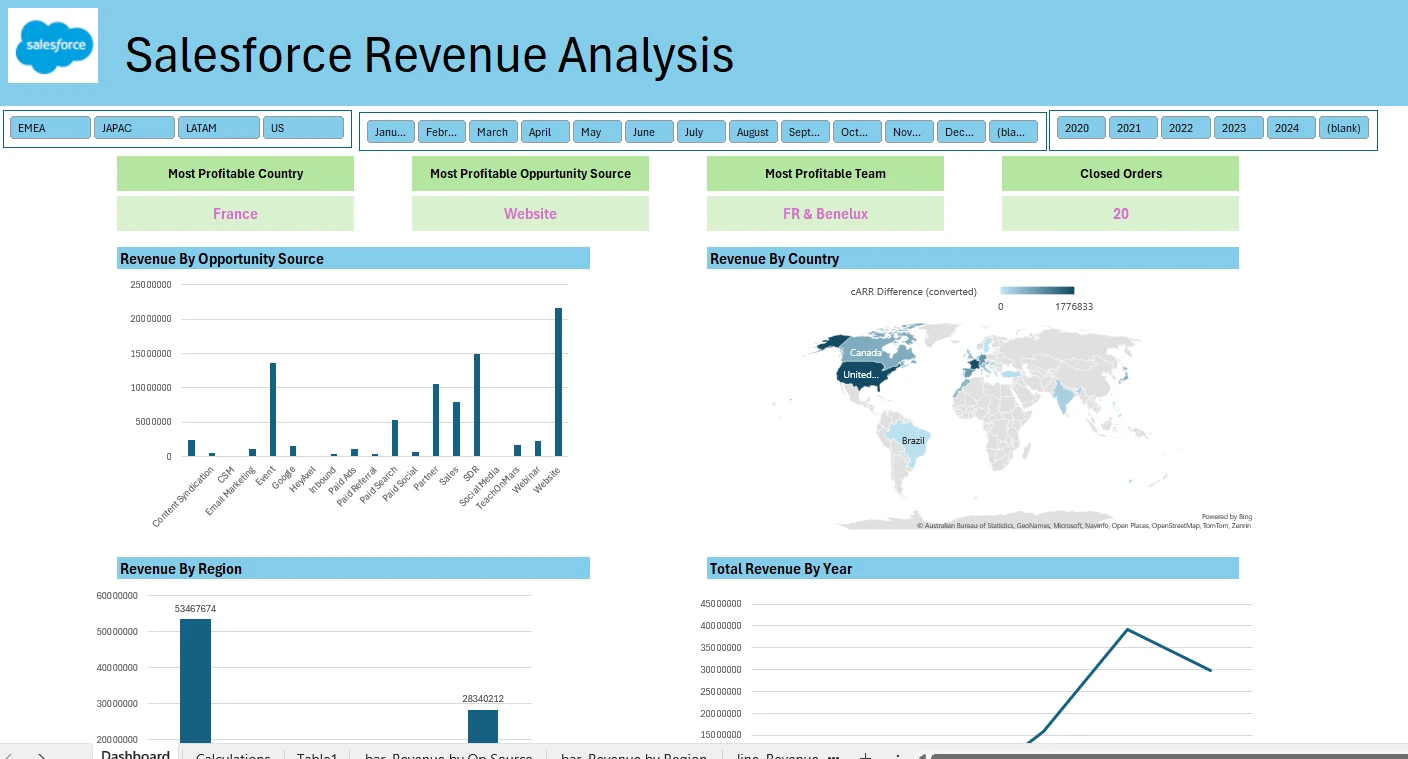
The Salesforce Revenue Analysis Dashboard provides a comprehensive overview of the company's revenue performance across different regions, opportunity sources, and time periods. This dashboard is designed to assist stakeholders in making data-driven decisions by visualizing key metrics and insights in an easy-to-understand format. The dashboard is fully interactive and can be provided as a product along side the analysis.
Key Features of the Dashboard:
Most Profitable Country: The dashboard highlights that France is the most profitable country, offering insights into geographical performance and potential areas for expansion or increased investment.
Most Profitable Opportunity Source: Website is identified as the most profitable opportunity source, suggesting the effectiveness of the company's online presence and digital marketing strategies.
Most Profitable Team: The FR & Benelux team is recognized for their exceptional performance, indicating strong sales and customer engagement in these regions.
Closed Orders: The total number of closed orders is displayed prominently, showing a total of 20 closed orders, which helps in tracking sales efficiency and success rates.
Revenue by Opportunity Source: A bar chart visualizes the revenue generated from different opportunity sources, with 'Website' and 'Paid Social' being the top contributors. This helps in understanding which channels are most effective for generating revenue.
Revenue by Country: A world map illustrates revenue distribution across different countries, with a color gradient representing the revenue difference in cARR (converted Annual Recurring Revenue). The map highlights key revenue-generating countries like the United States, Canada, and Brazil.
Revenue by Region: A bar chart breaks down revenue by region, with EMEA (Europe, Middle East, and Africa) leading with significant revenue, followed by other regions such as the US and LATAM (Latin America).
Total Revenue by Year: A line chart depicts the total revenue trend over the years, providing a historical perspective on revenue growth and identifying any patterns or anomalies.
Results Findings
Invest in Top Sources: Increase resources for Website, Events, and SDR channels.
Regional Focus: Develop targeted strategies for EMEA and US regions.
Optimize Stages: Improve sales stage progression for top sources.
Monitor and Adapt: Continuously use data to refine focus and resource allocation.
Resources
Map Charts in Excel - https://www.youtube.com/watch?v=omMiBZ3mxxE
Like this project
Posted Jun 3, 2024
A Data Analysis project analyzing Salesforce data. Contribute to crashlattice57/Salesforce-Data-Analysis-Project development by creating an account on GitHub.
Likes
0
Views
6