Complex Data Visualization
Sirajum Munir GALIB
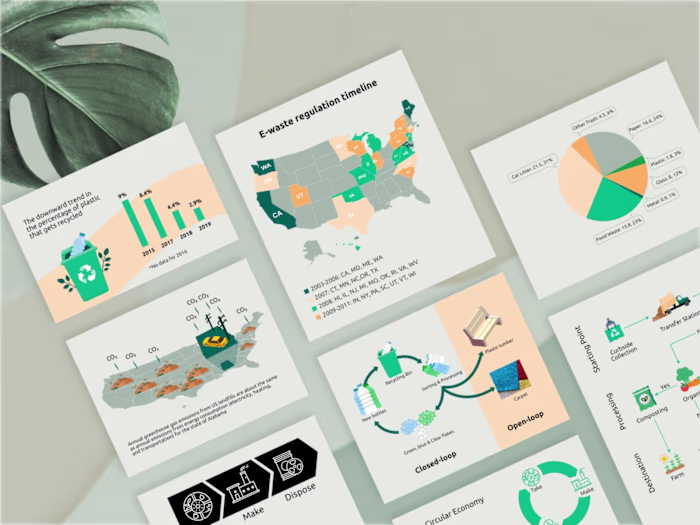
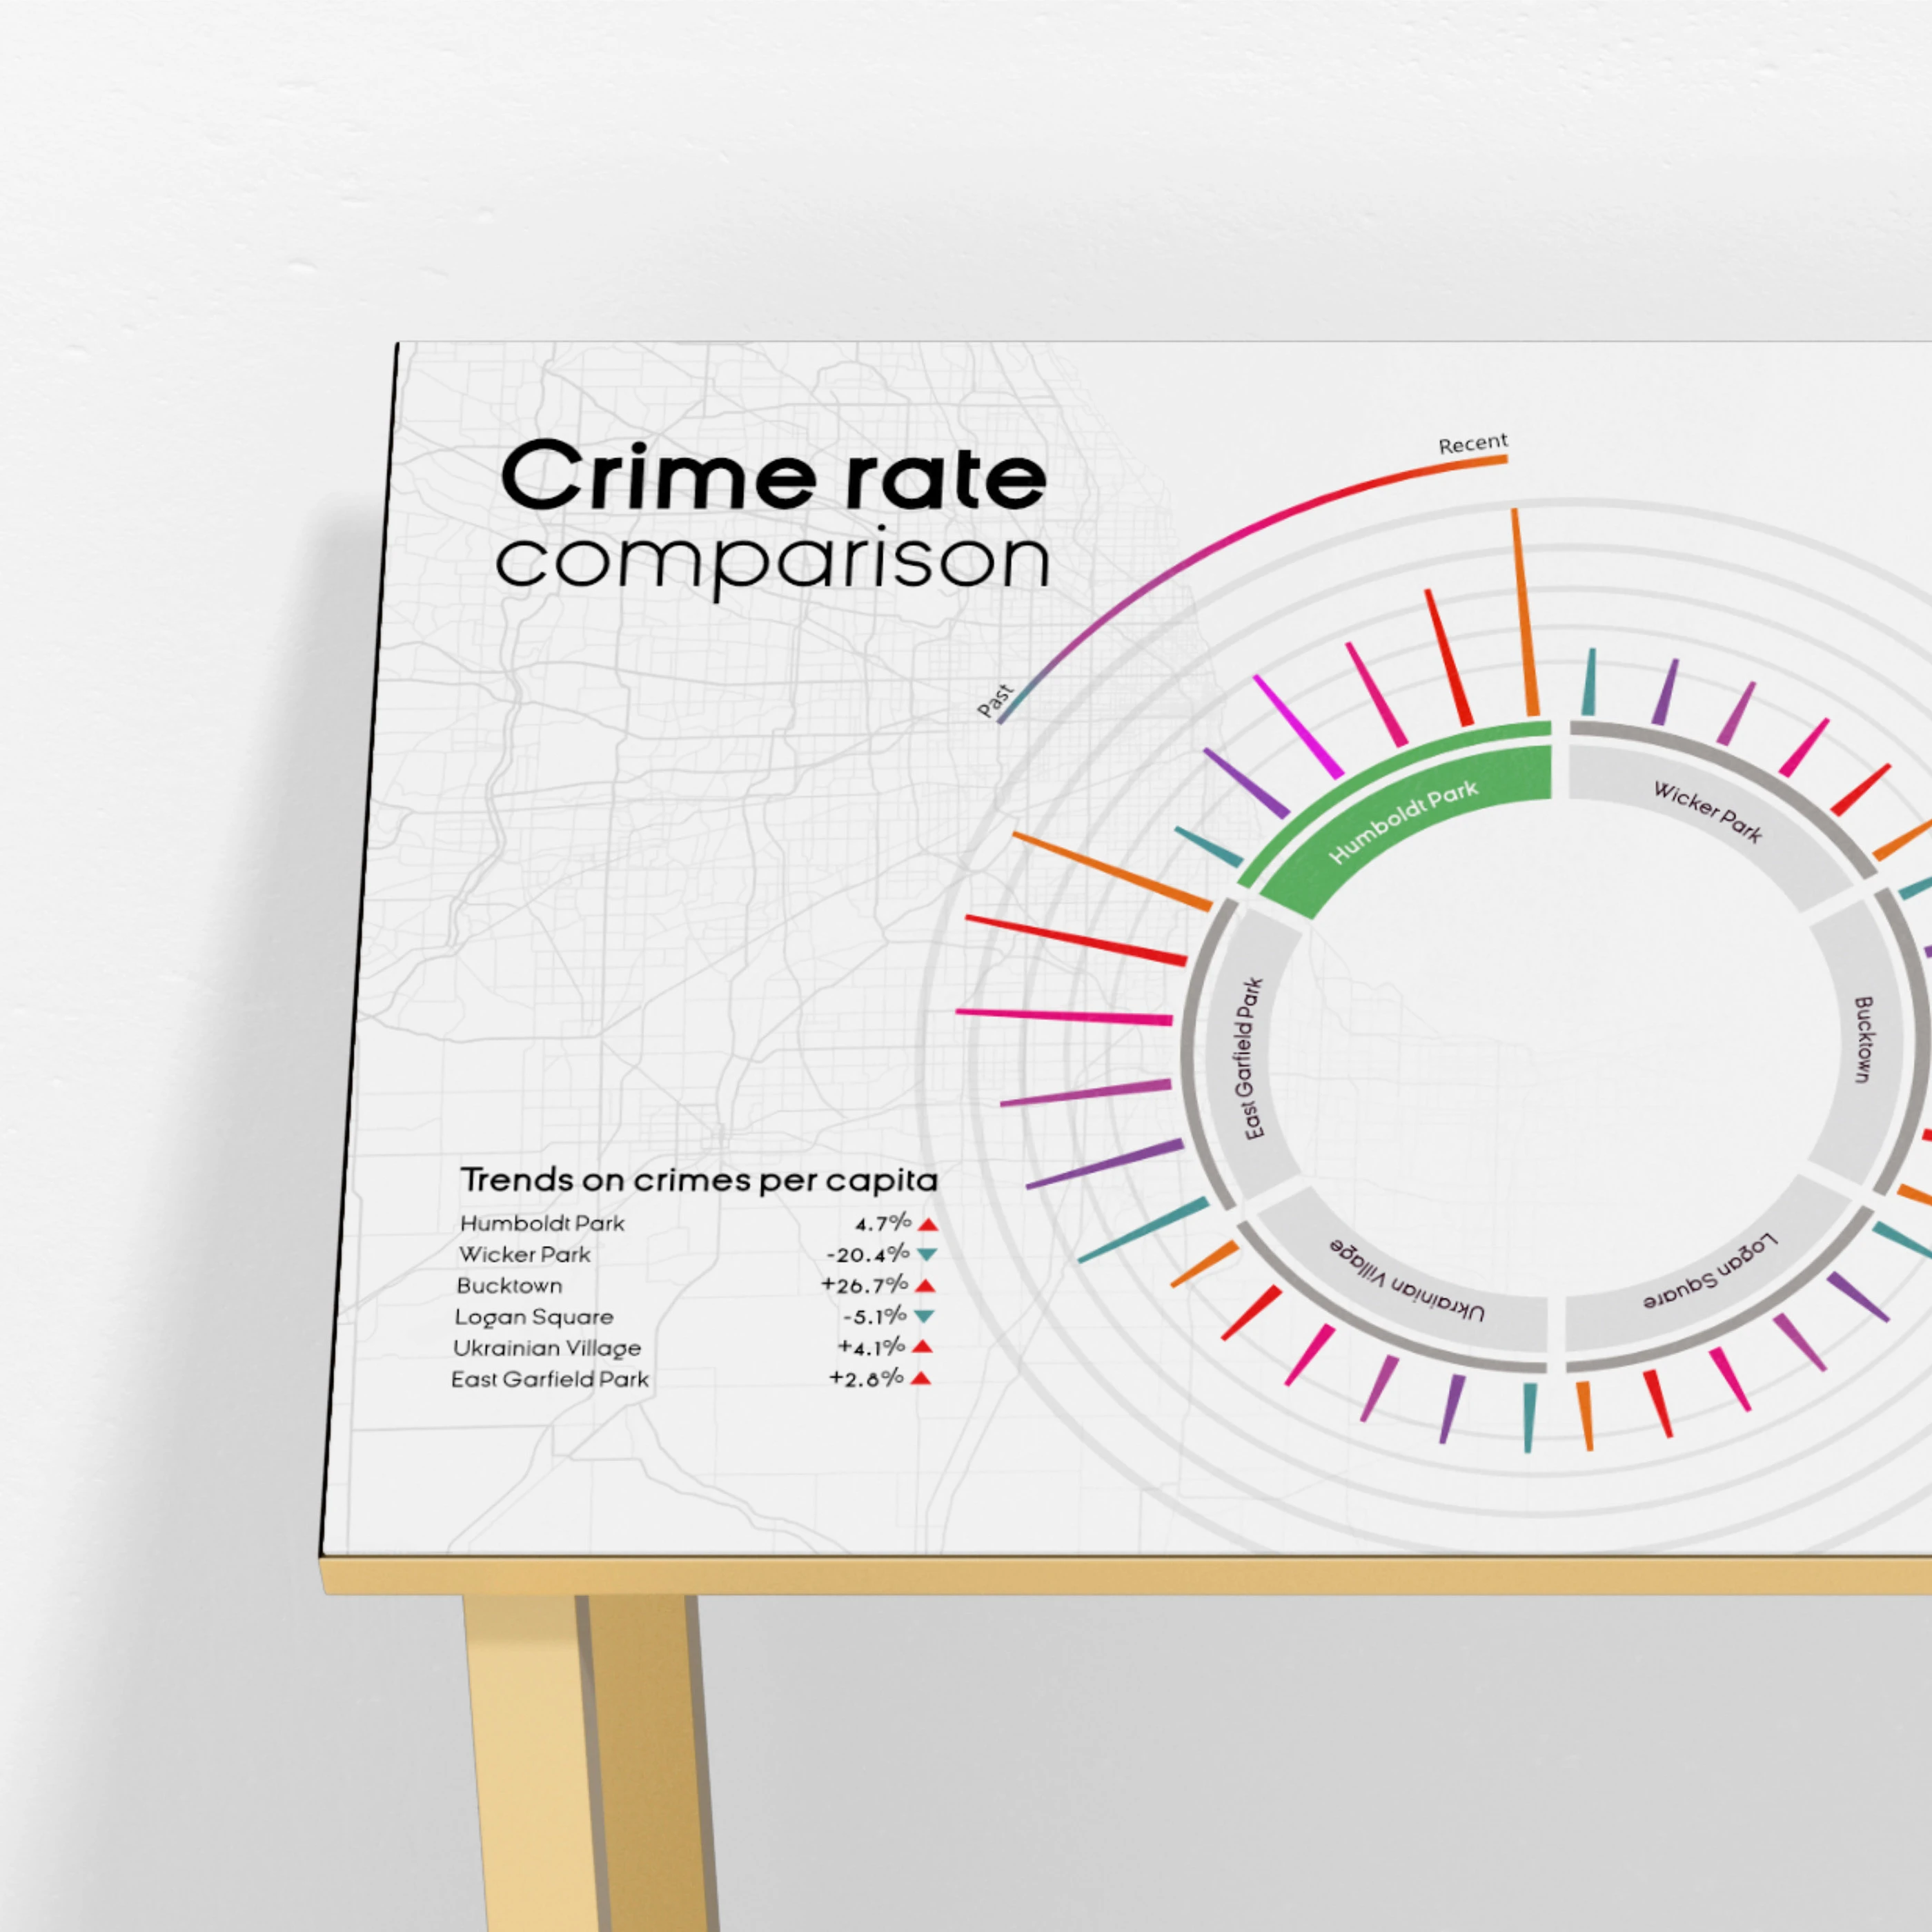
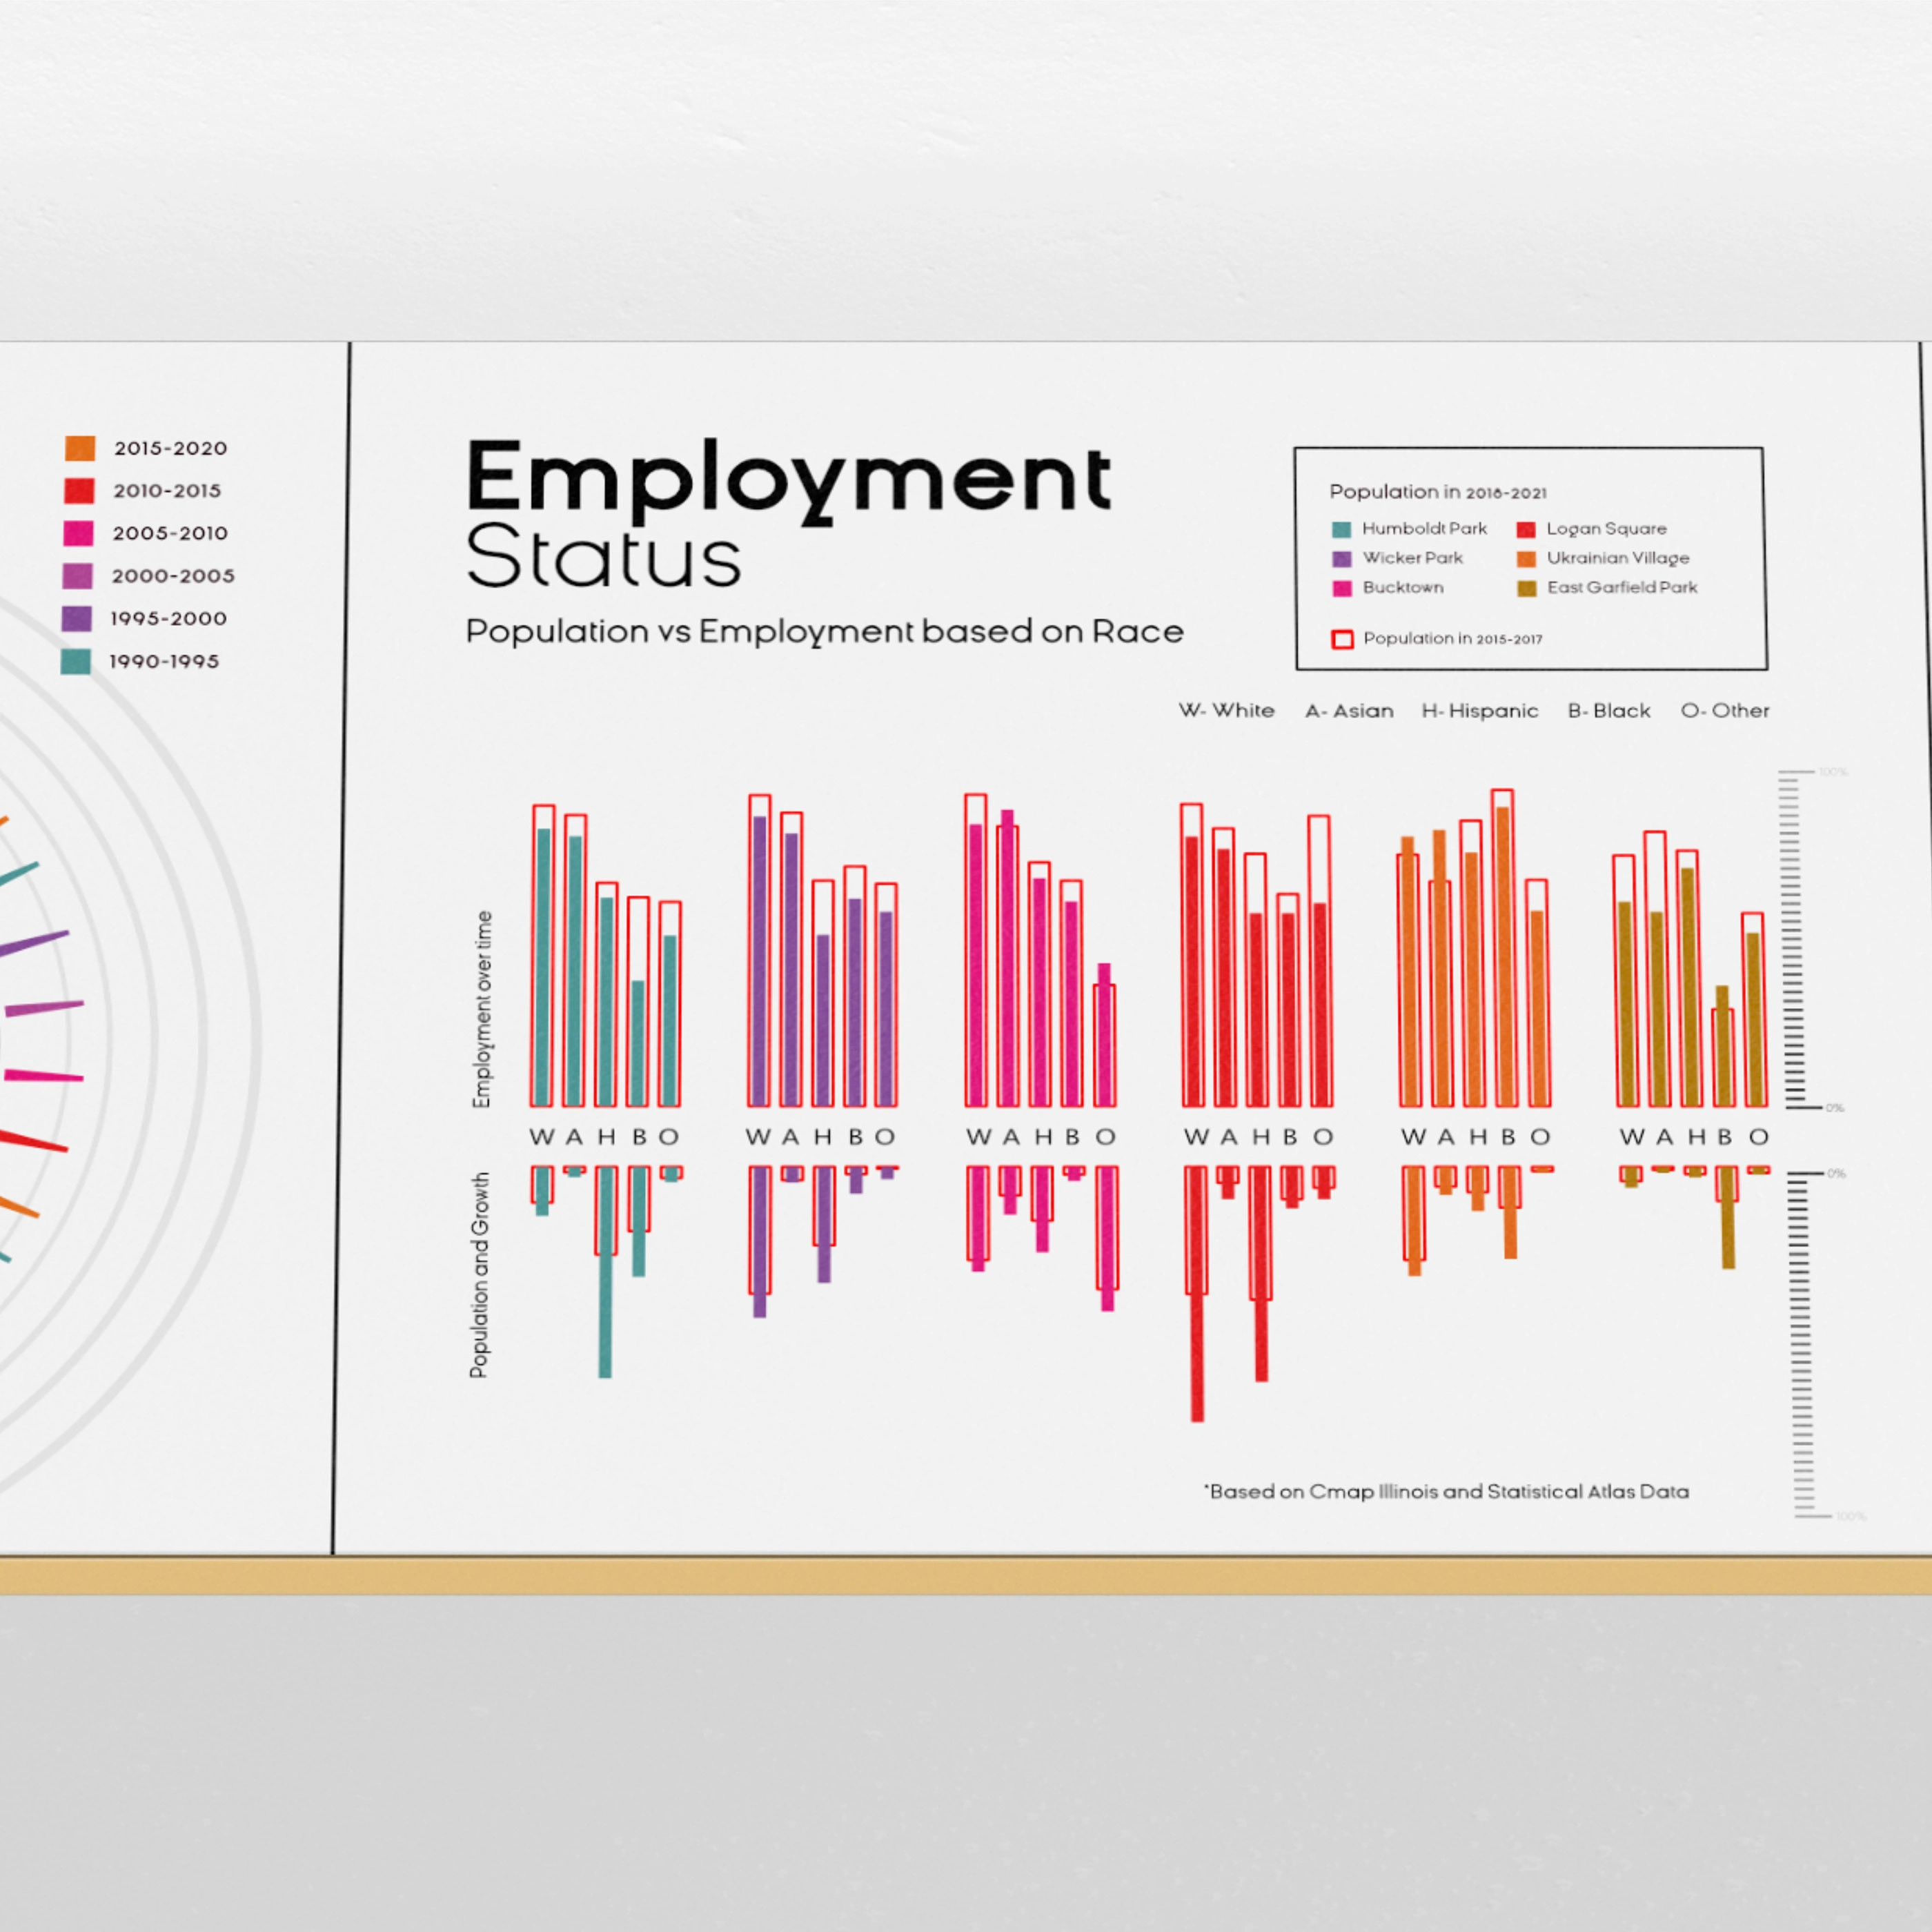
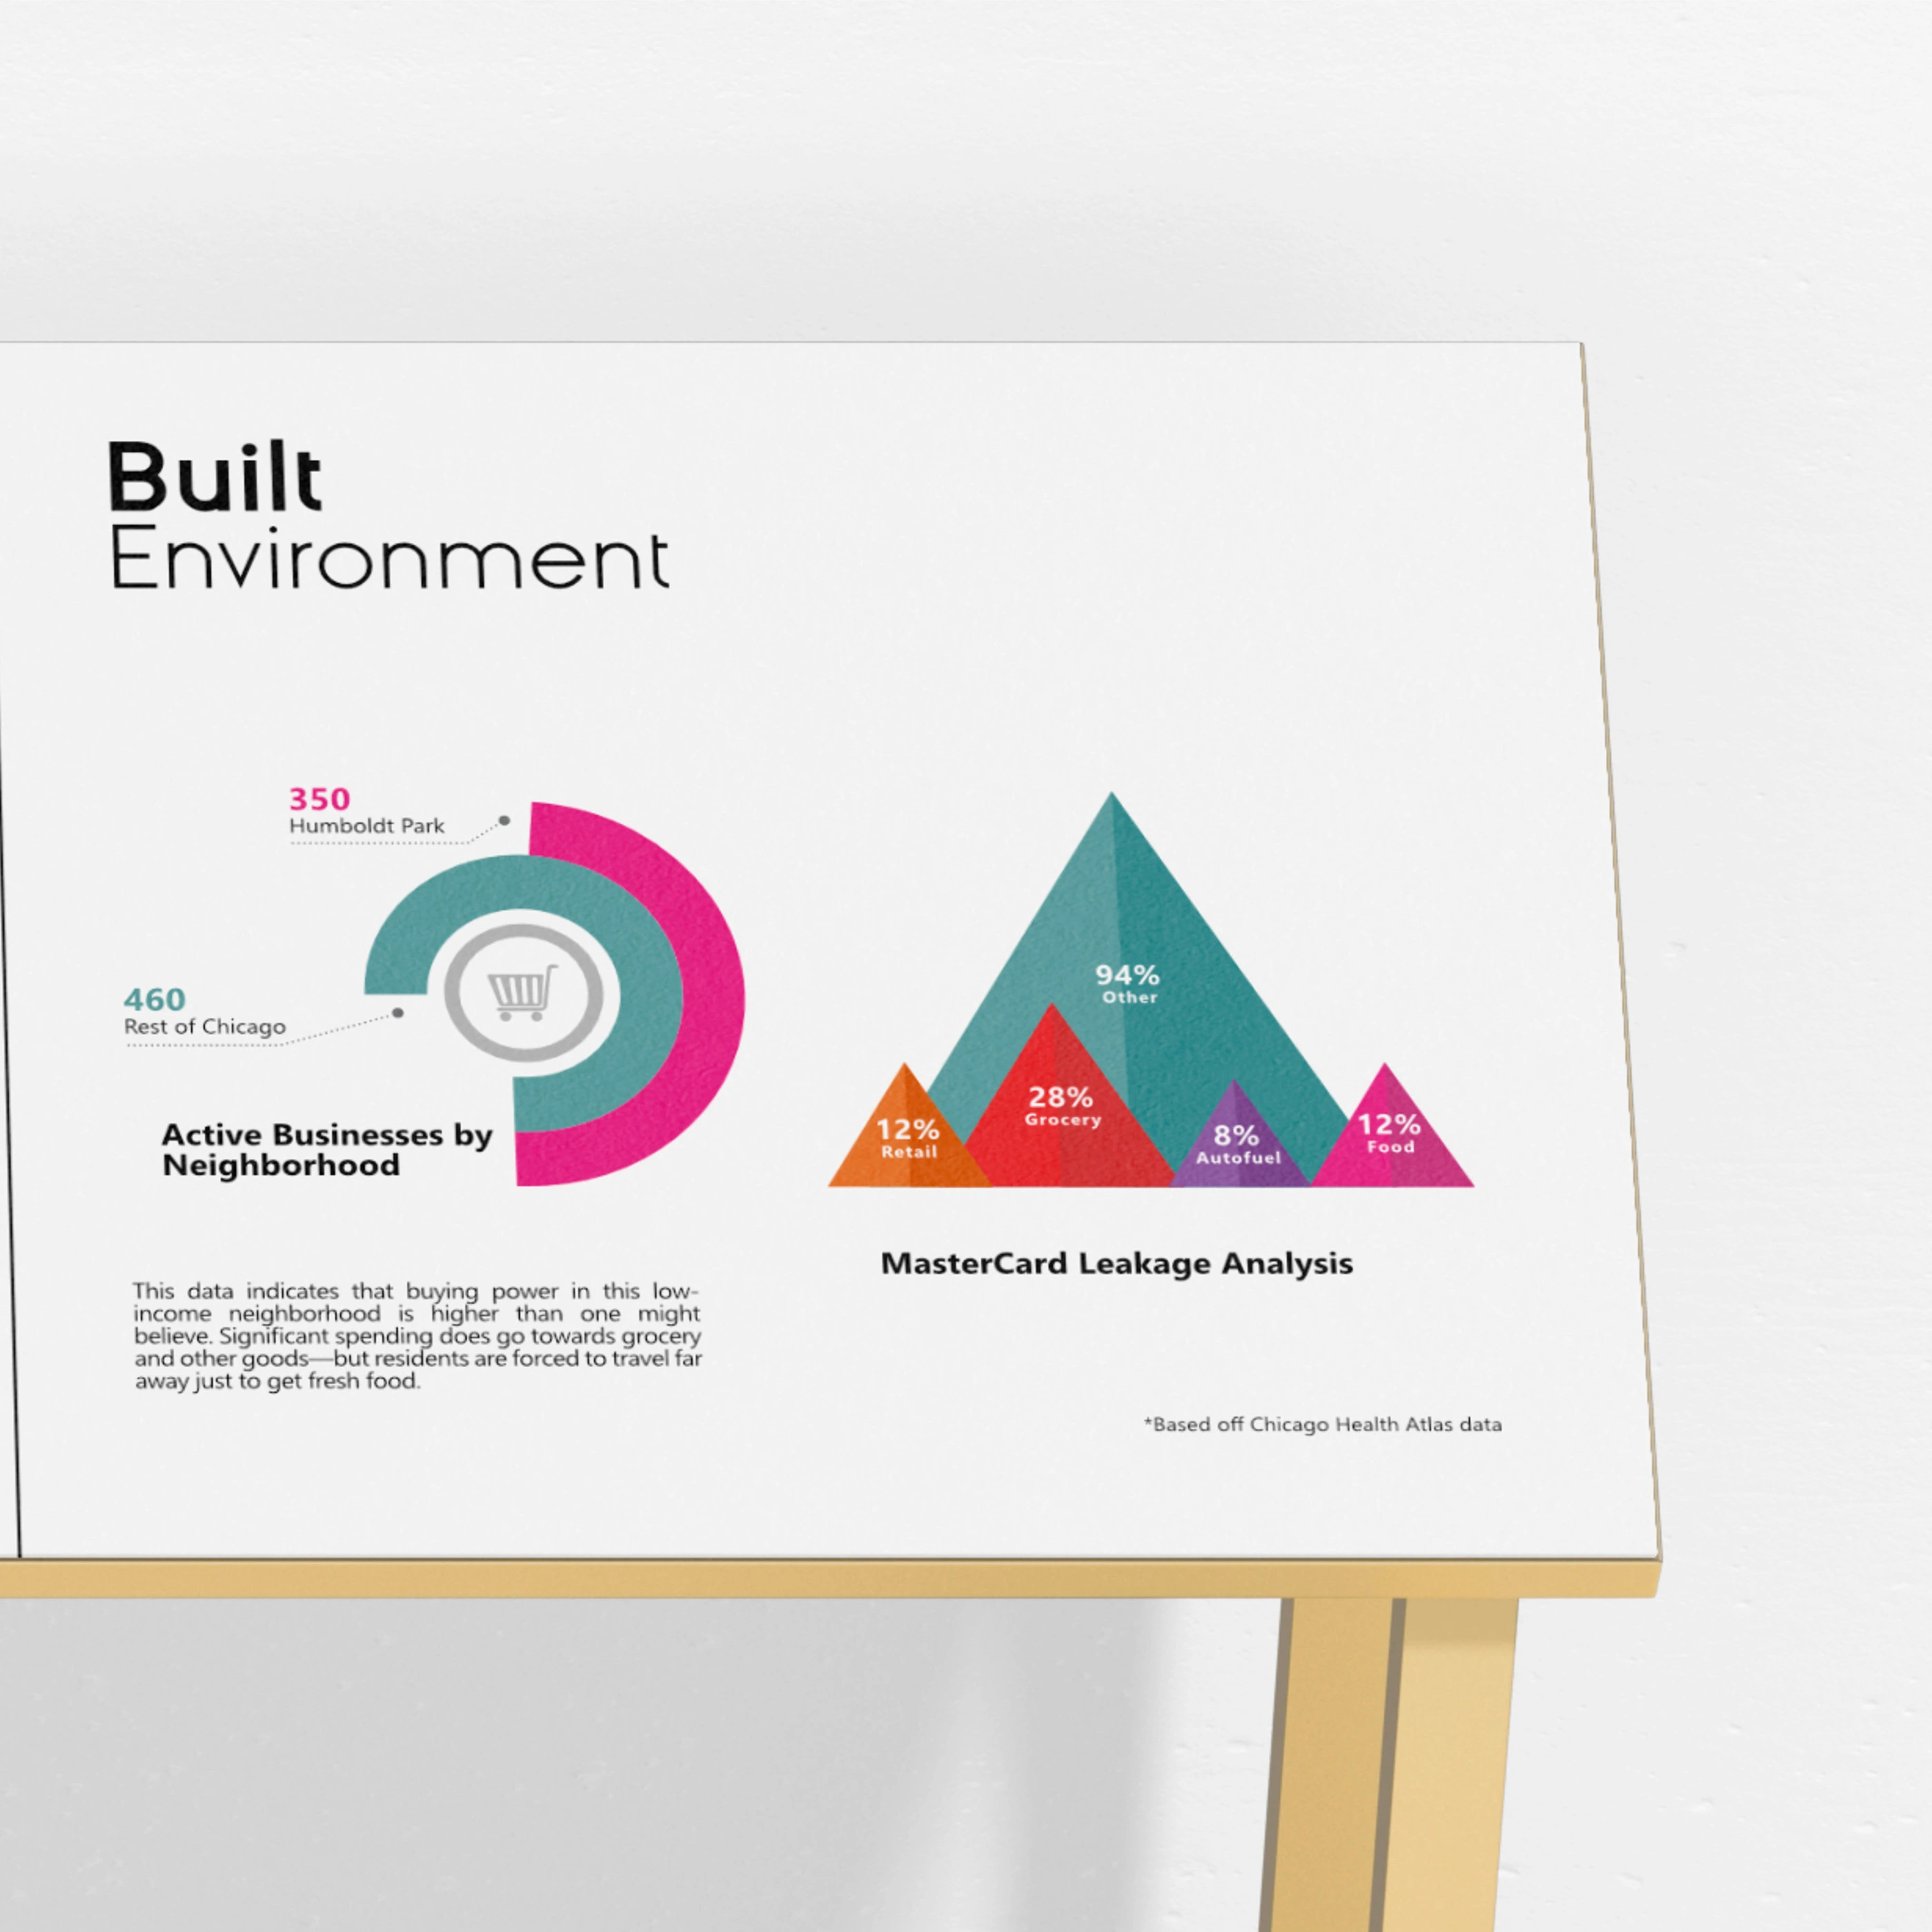
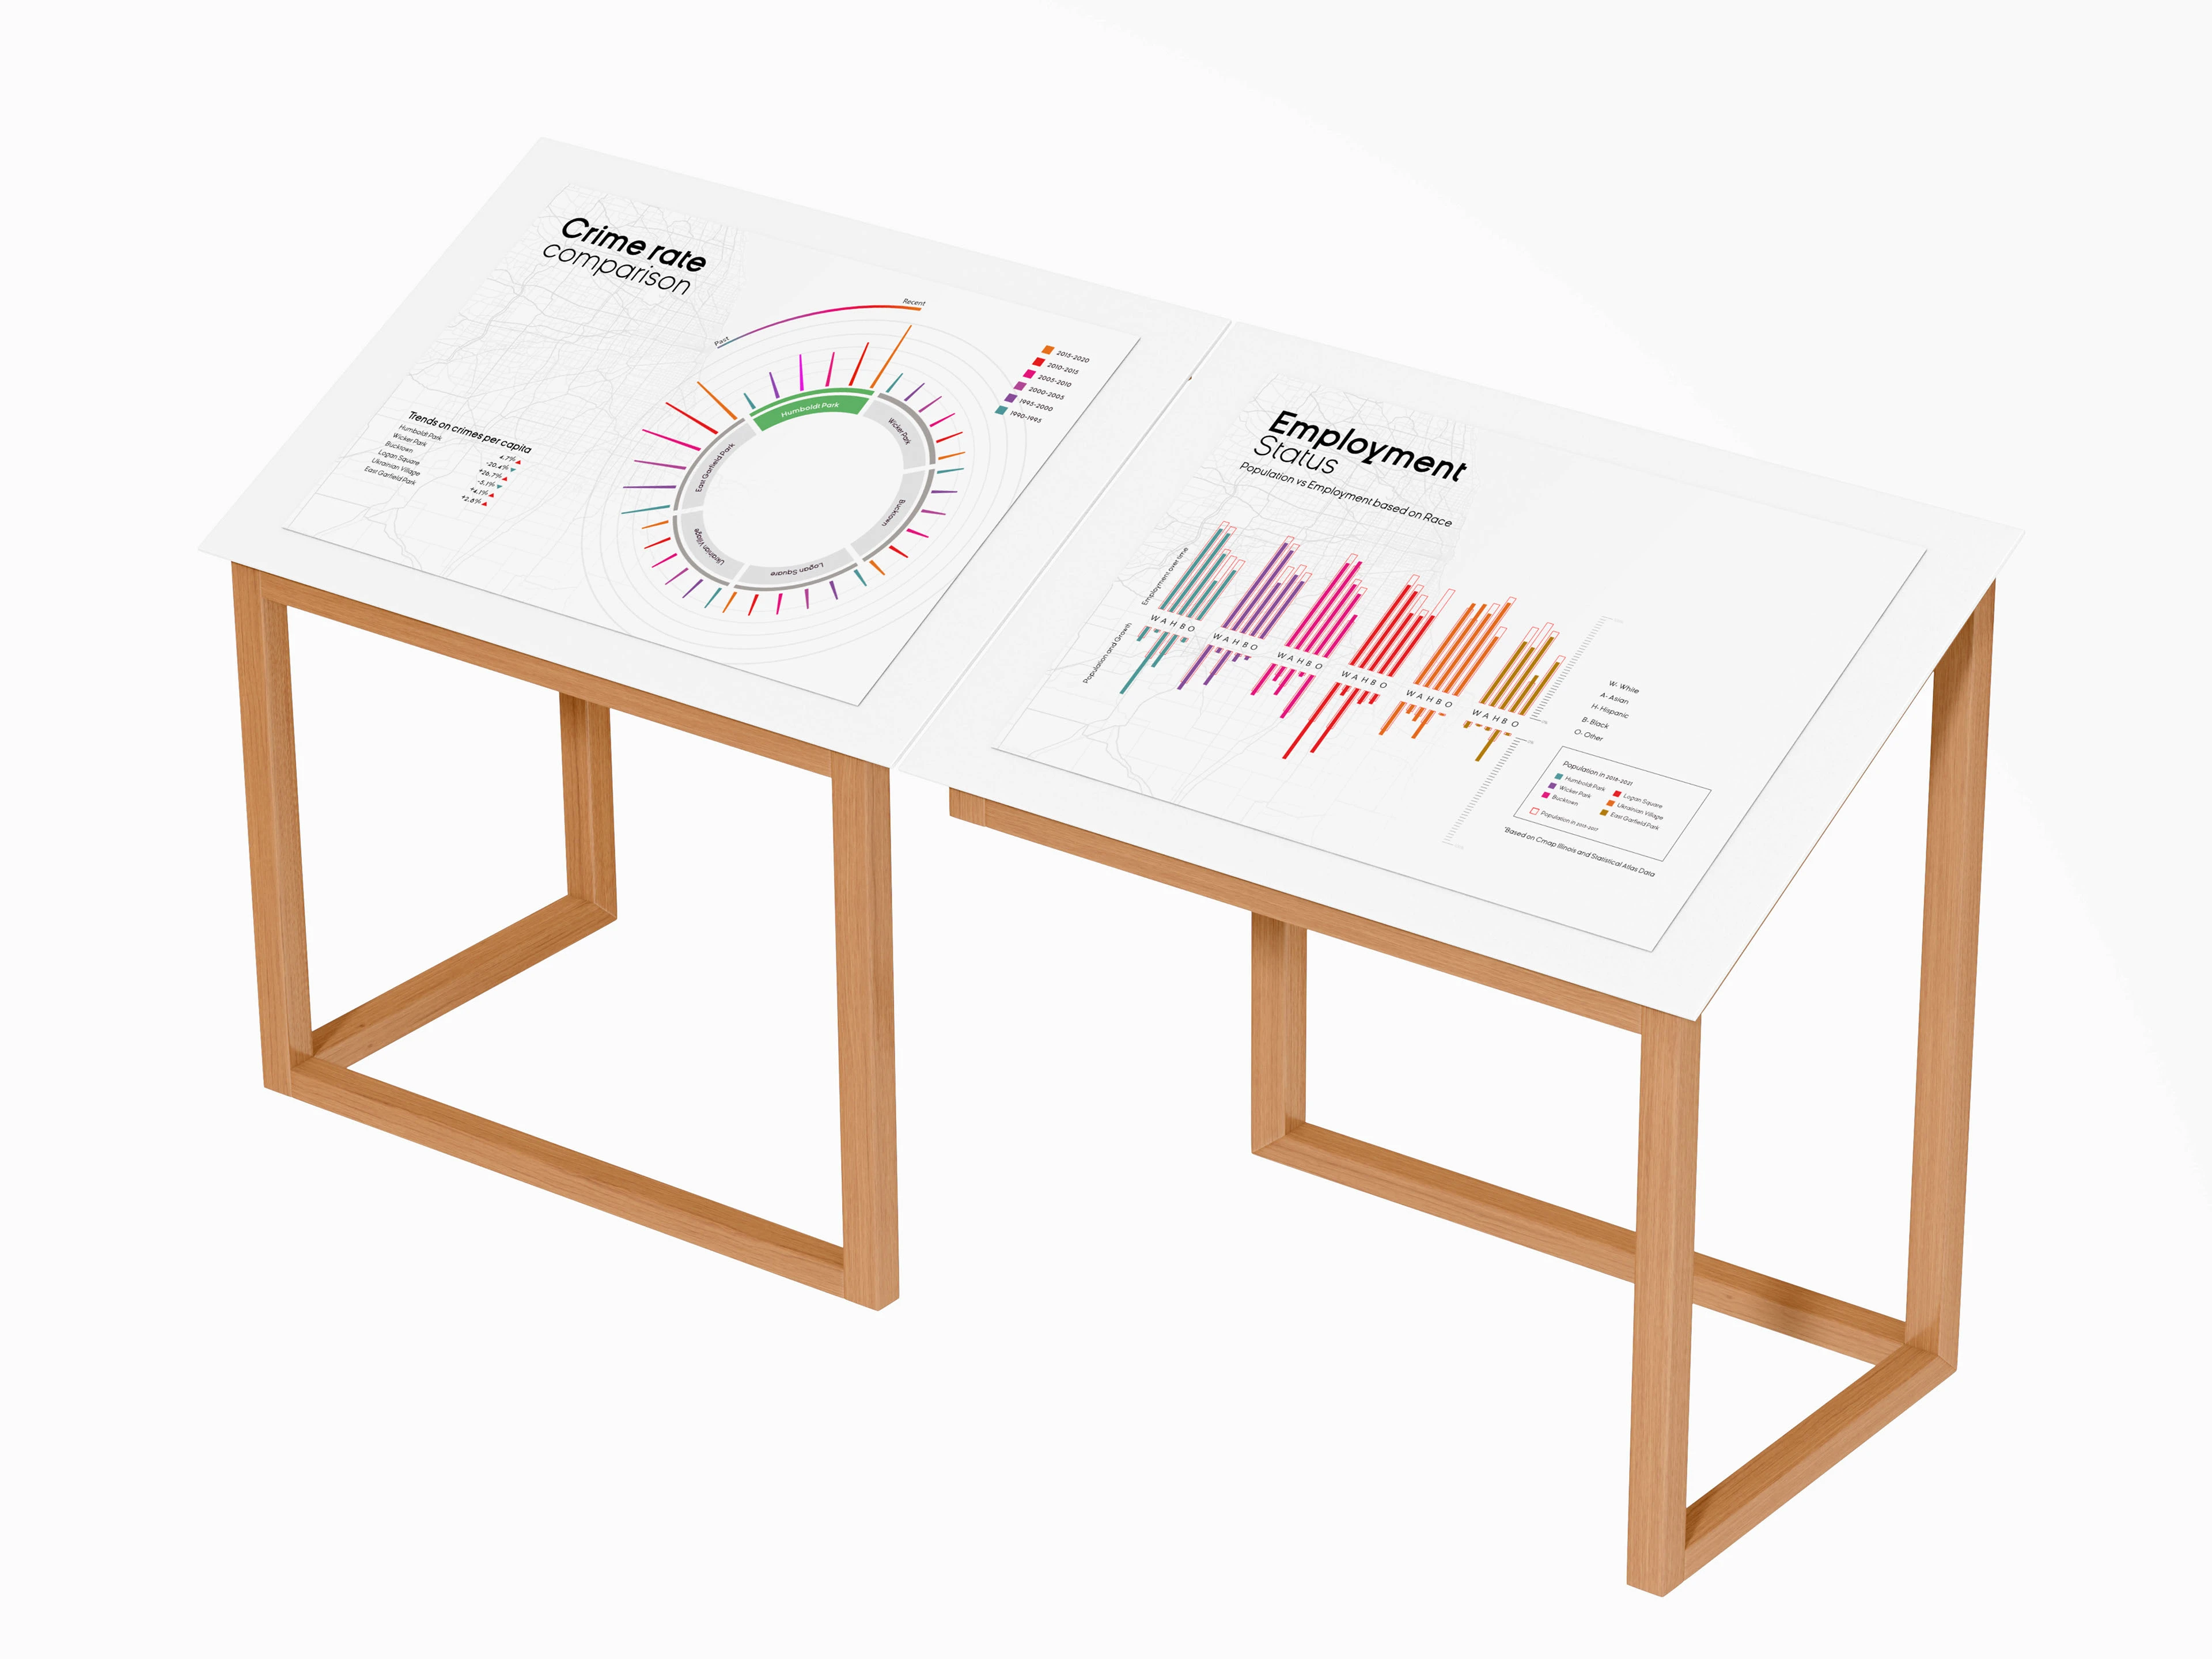
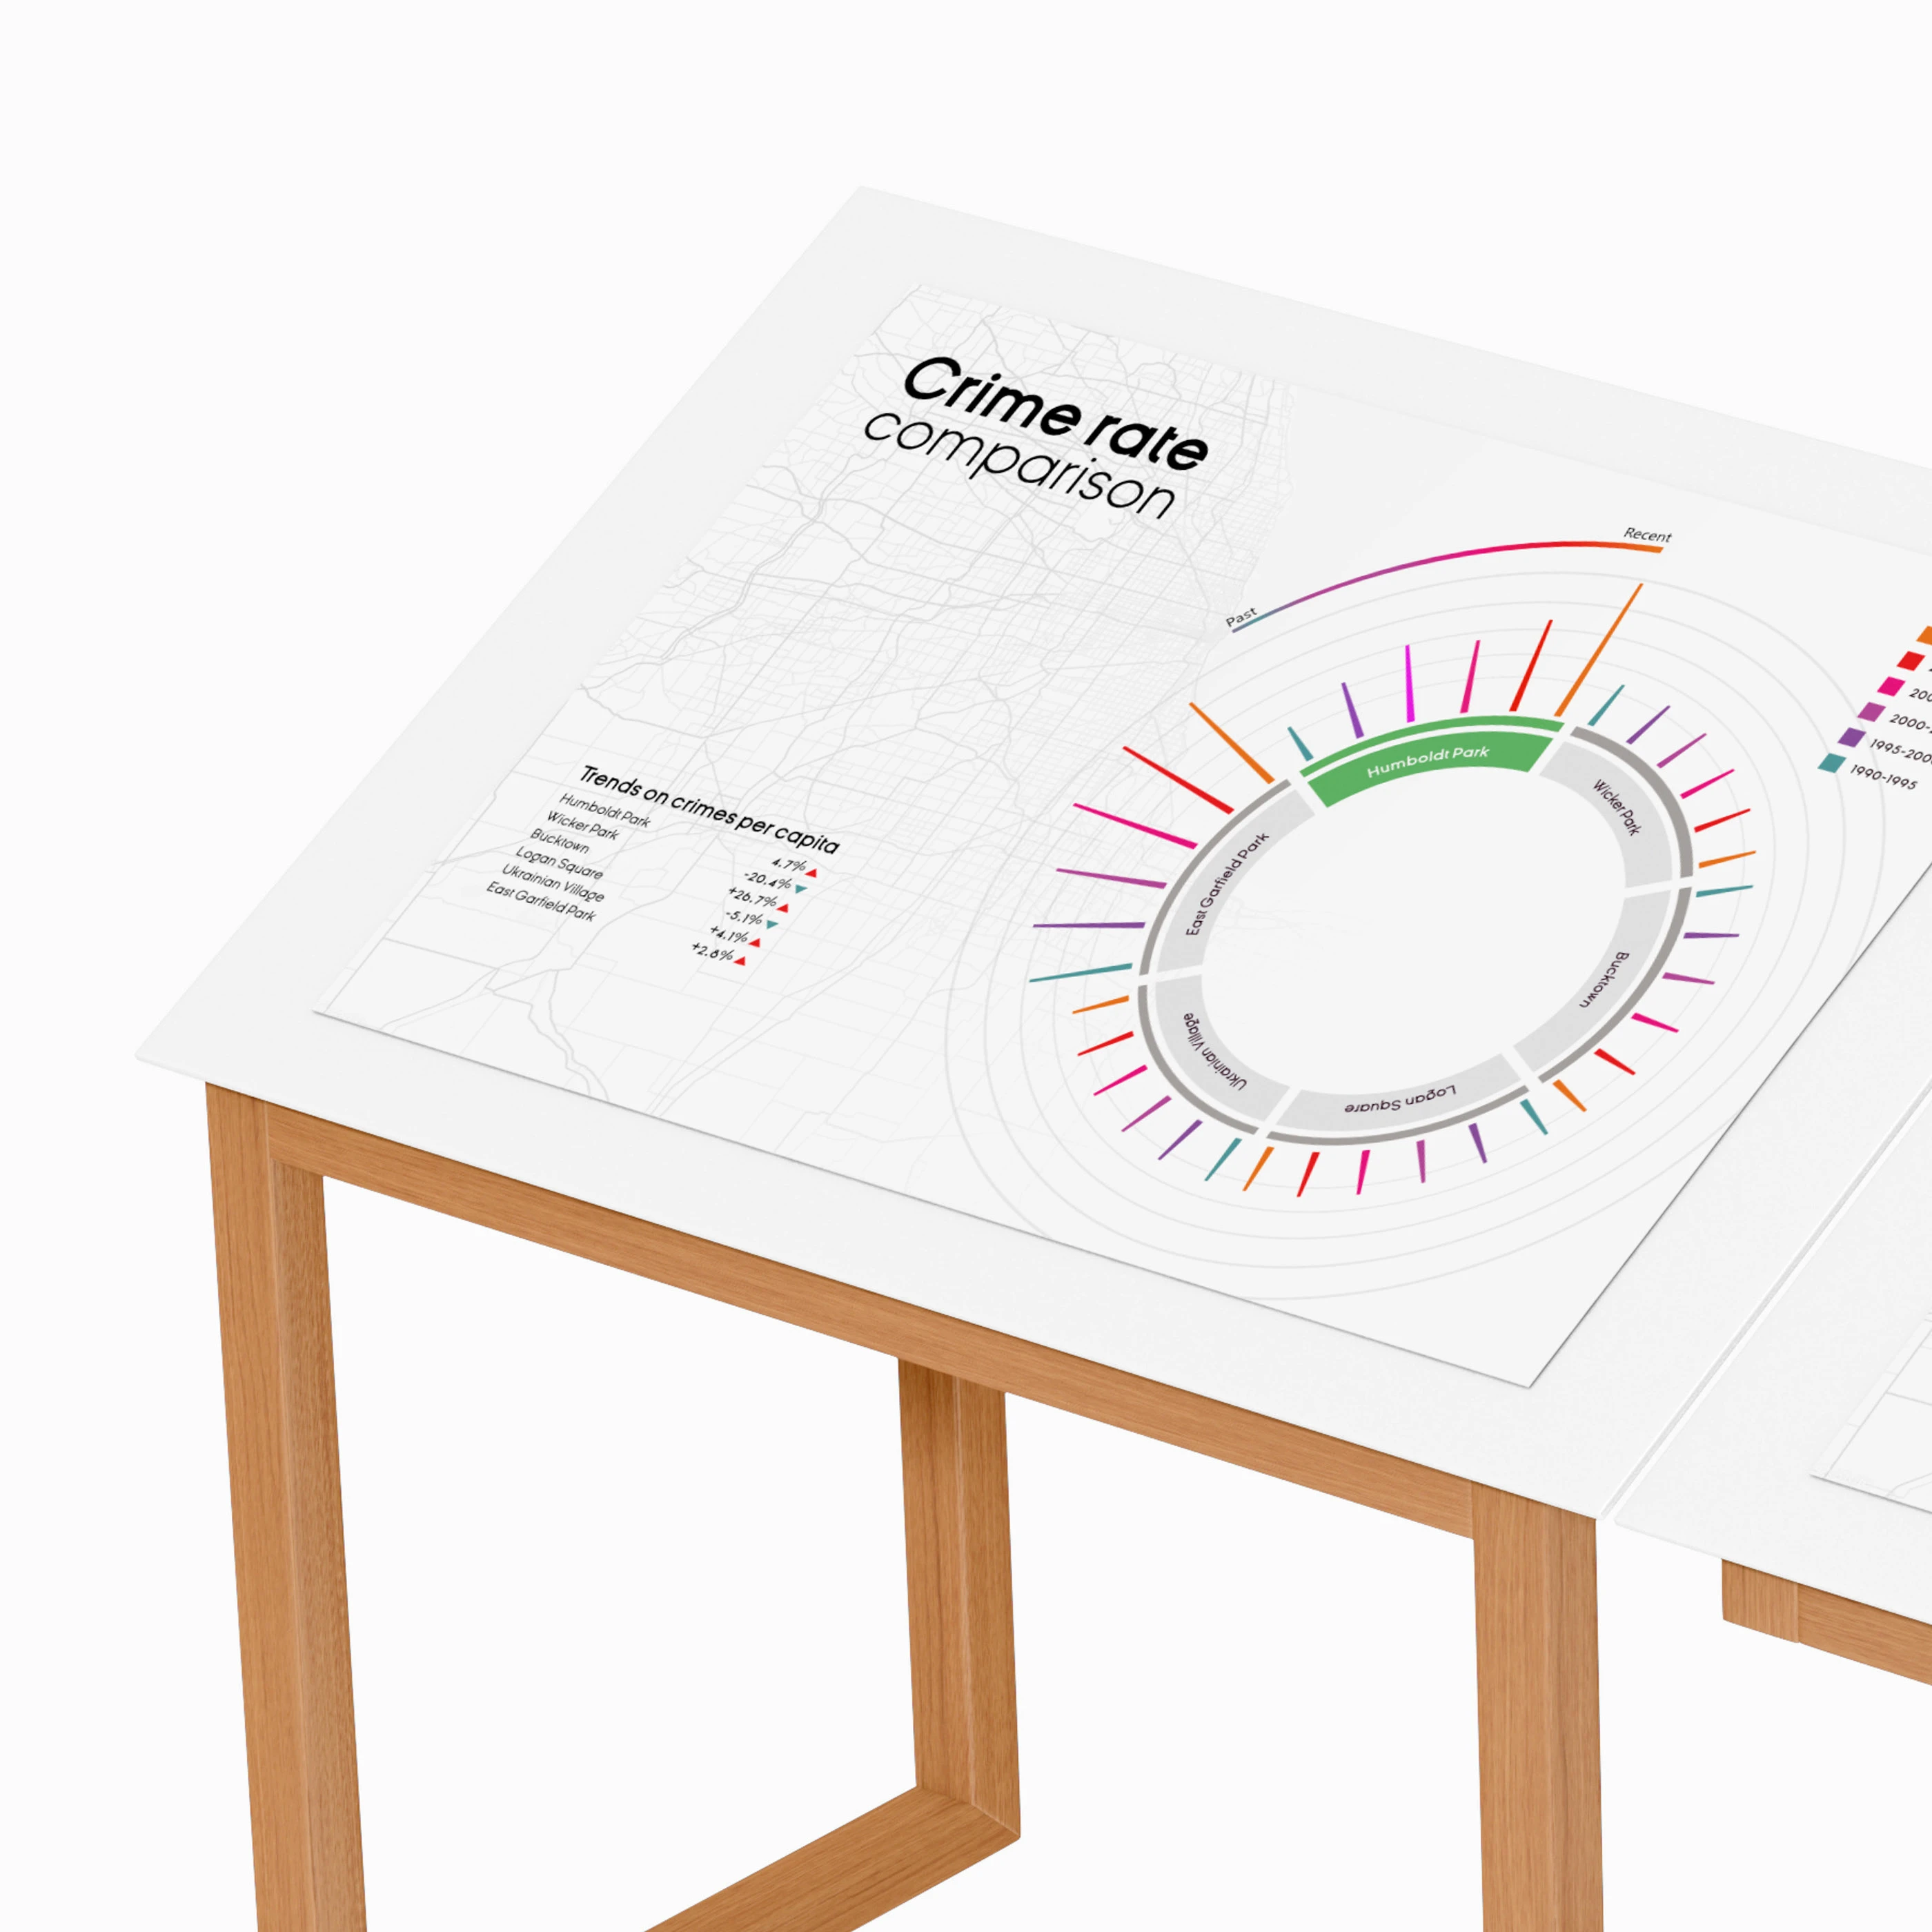
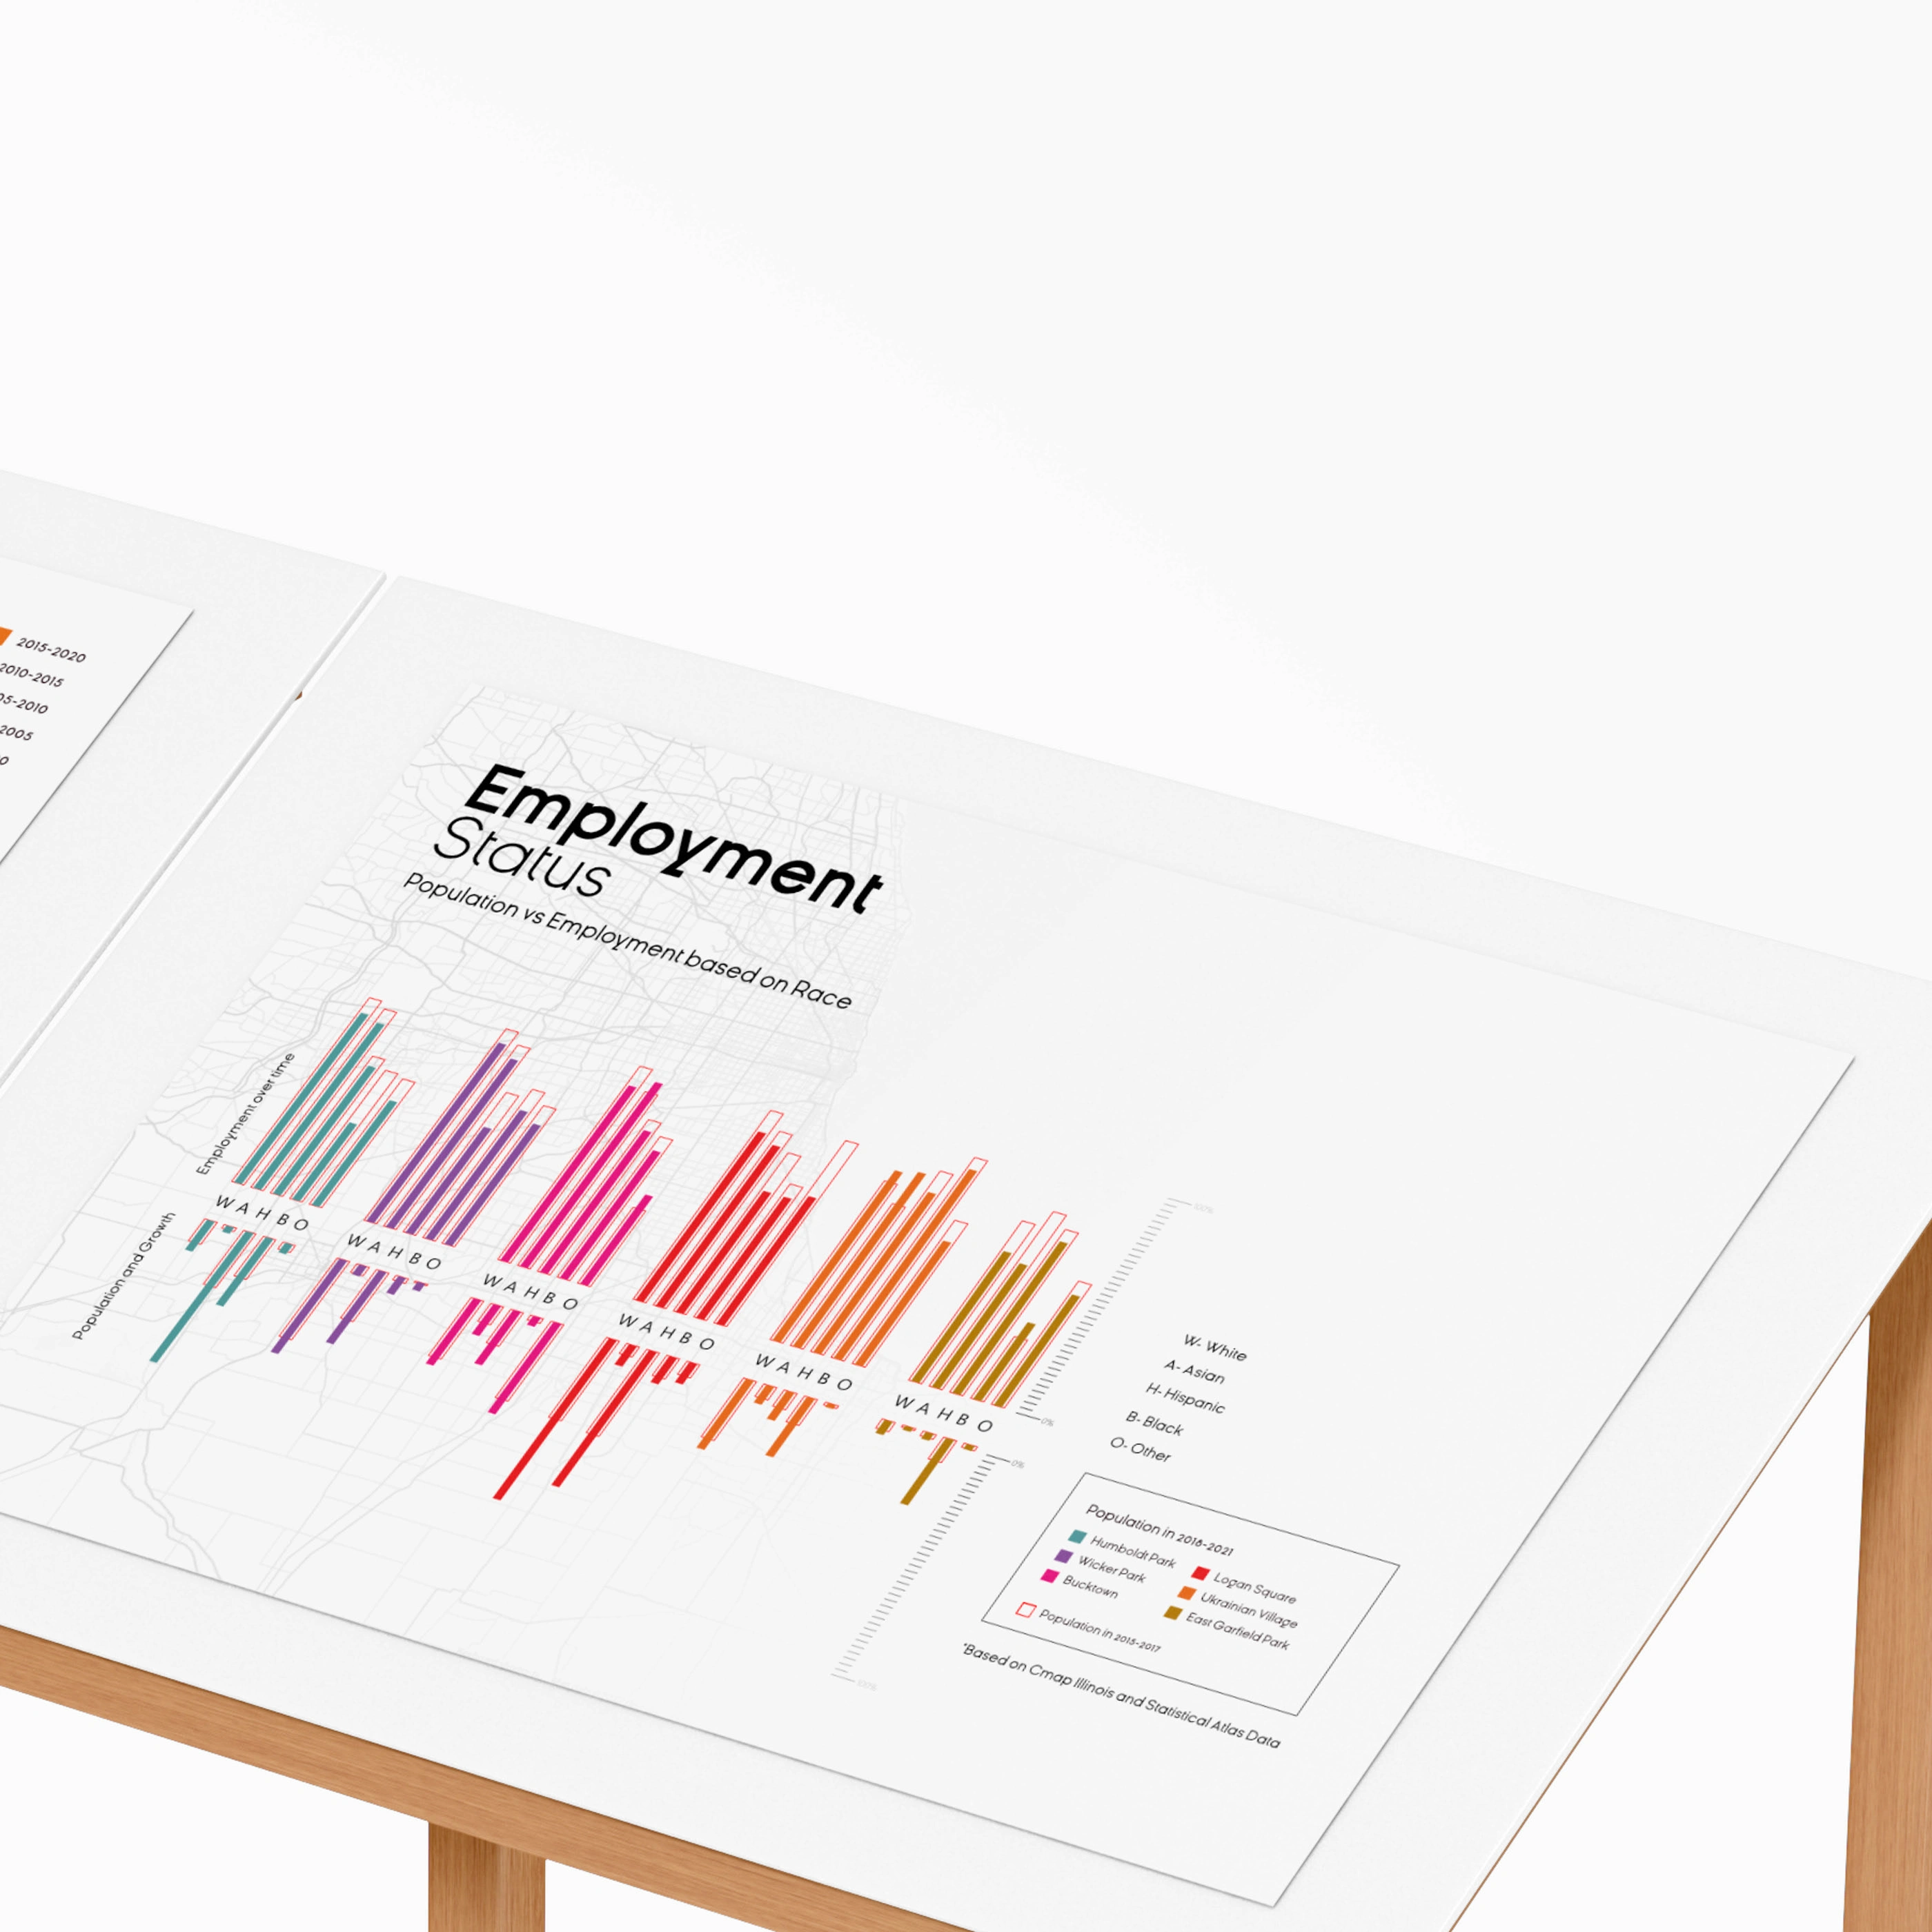
Even complex data isn't boring if you can visualize it properly. We visualized the crime rate, employment status, and purchasing ability of 6 neighborhoods in Chicago to compare and find the best place for real estate investment.
Like this project
Posted Aug 30, 2023
An Excel sheet can be transformed into engaging graphics that are easy to understand without overwhelming the audience.