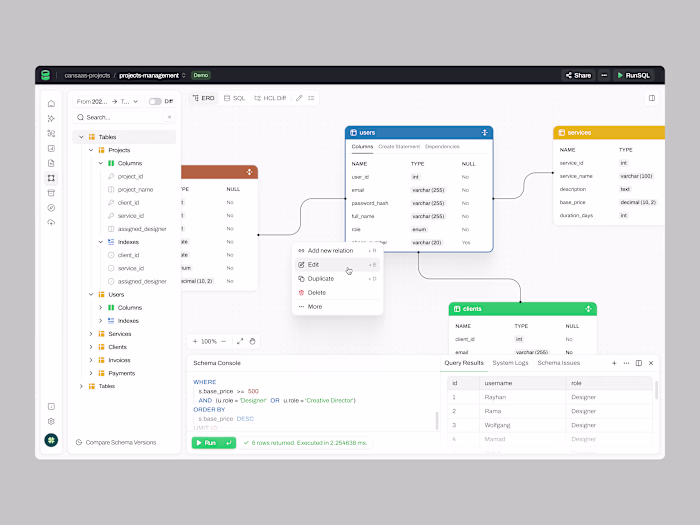
Database Visualitation Dashboard
Cansaas Agency
Overview
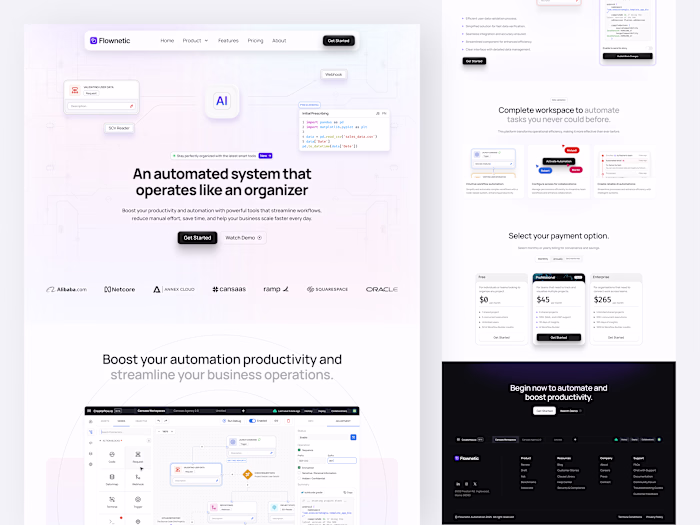
This dashboard presents a visual-centric approach to understanding complex database structures. The design turns raw tables, schema logic, and relational data into an interactive and readable workspace that helps teams navigate, edit, and validate data nodes with clarity and ease. It emphasizes simplicity, consistency, and smooth context switching within data-heavy environments.

The Challenge
Many database dashboards feel dense, rigid, and difficult to explore at scale. Users often struggle to trace relationships between tables, preview data, and manage schema updates in a unified interface. The main challenge was creating an experience that reduces cognitive load while still supporting advanced technical operations without compromising accuracy or depth.
Design Approach
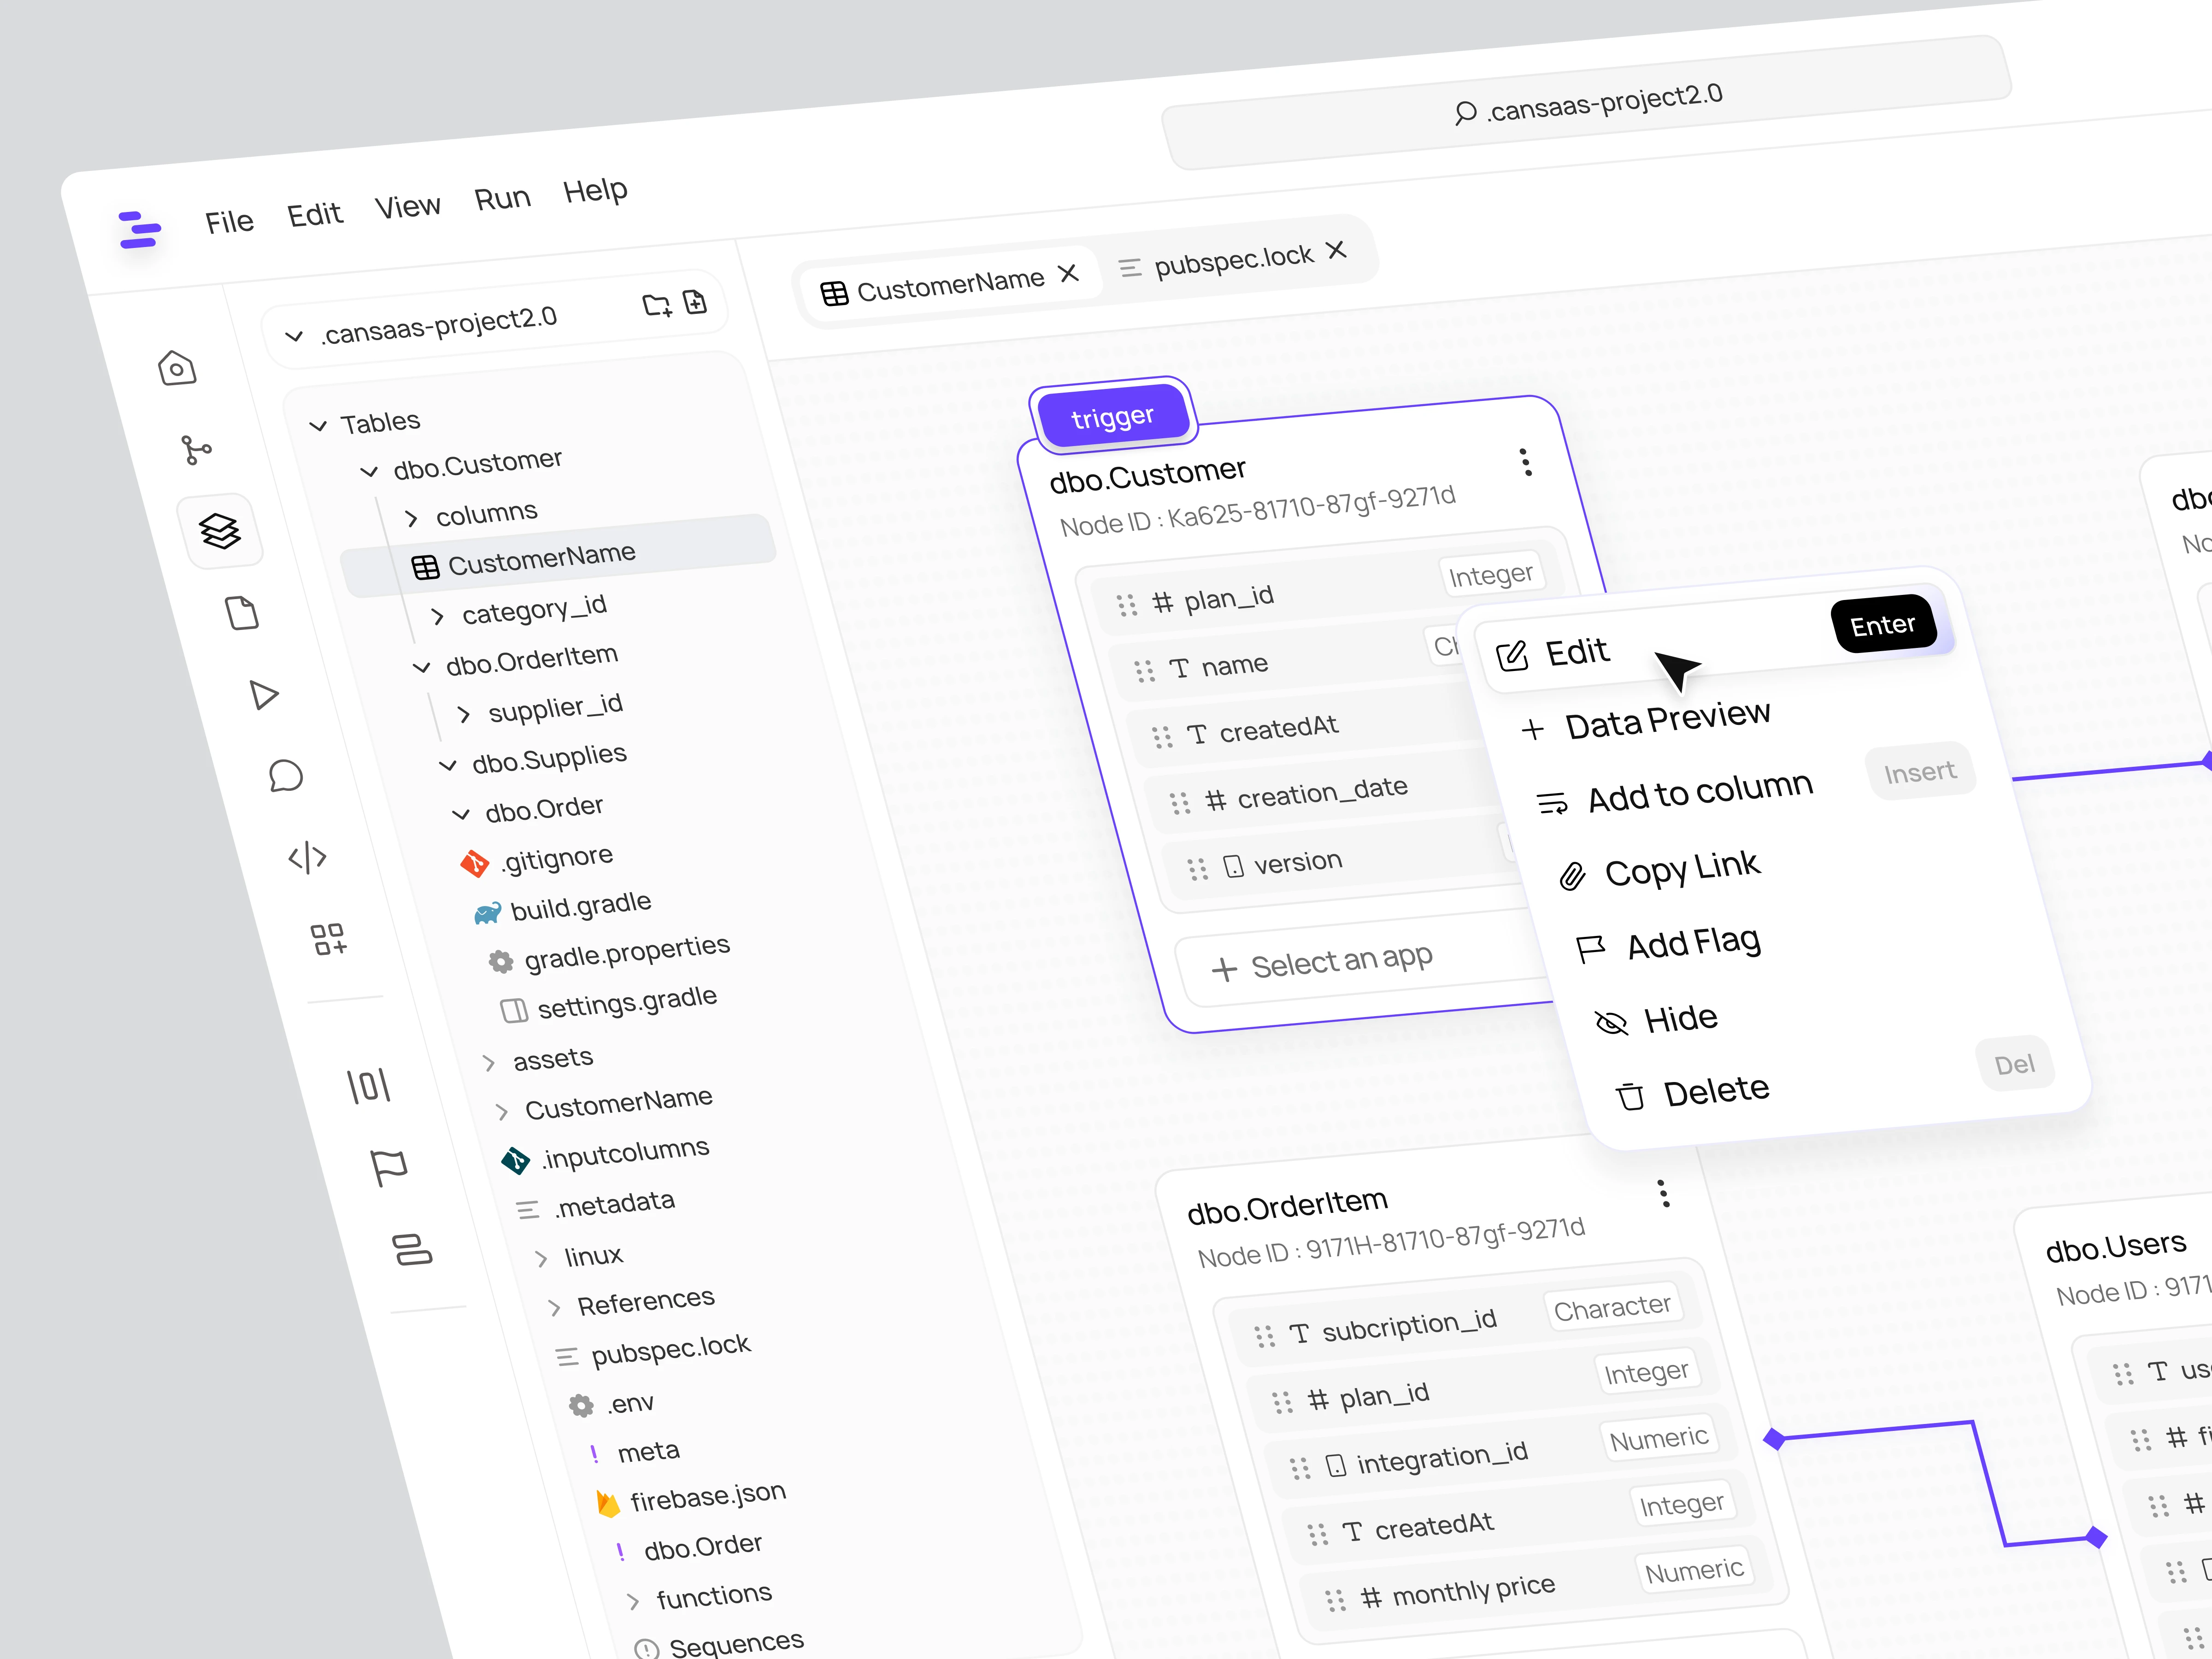
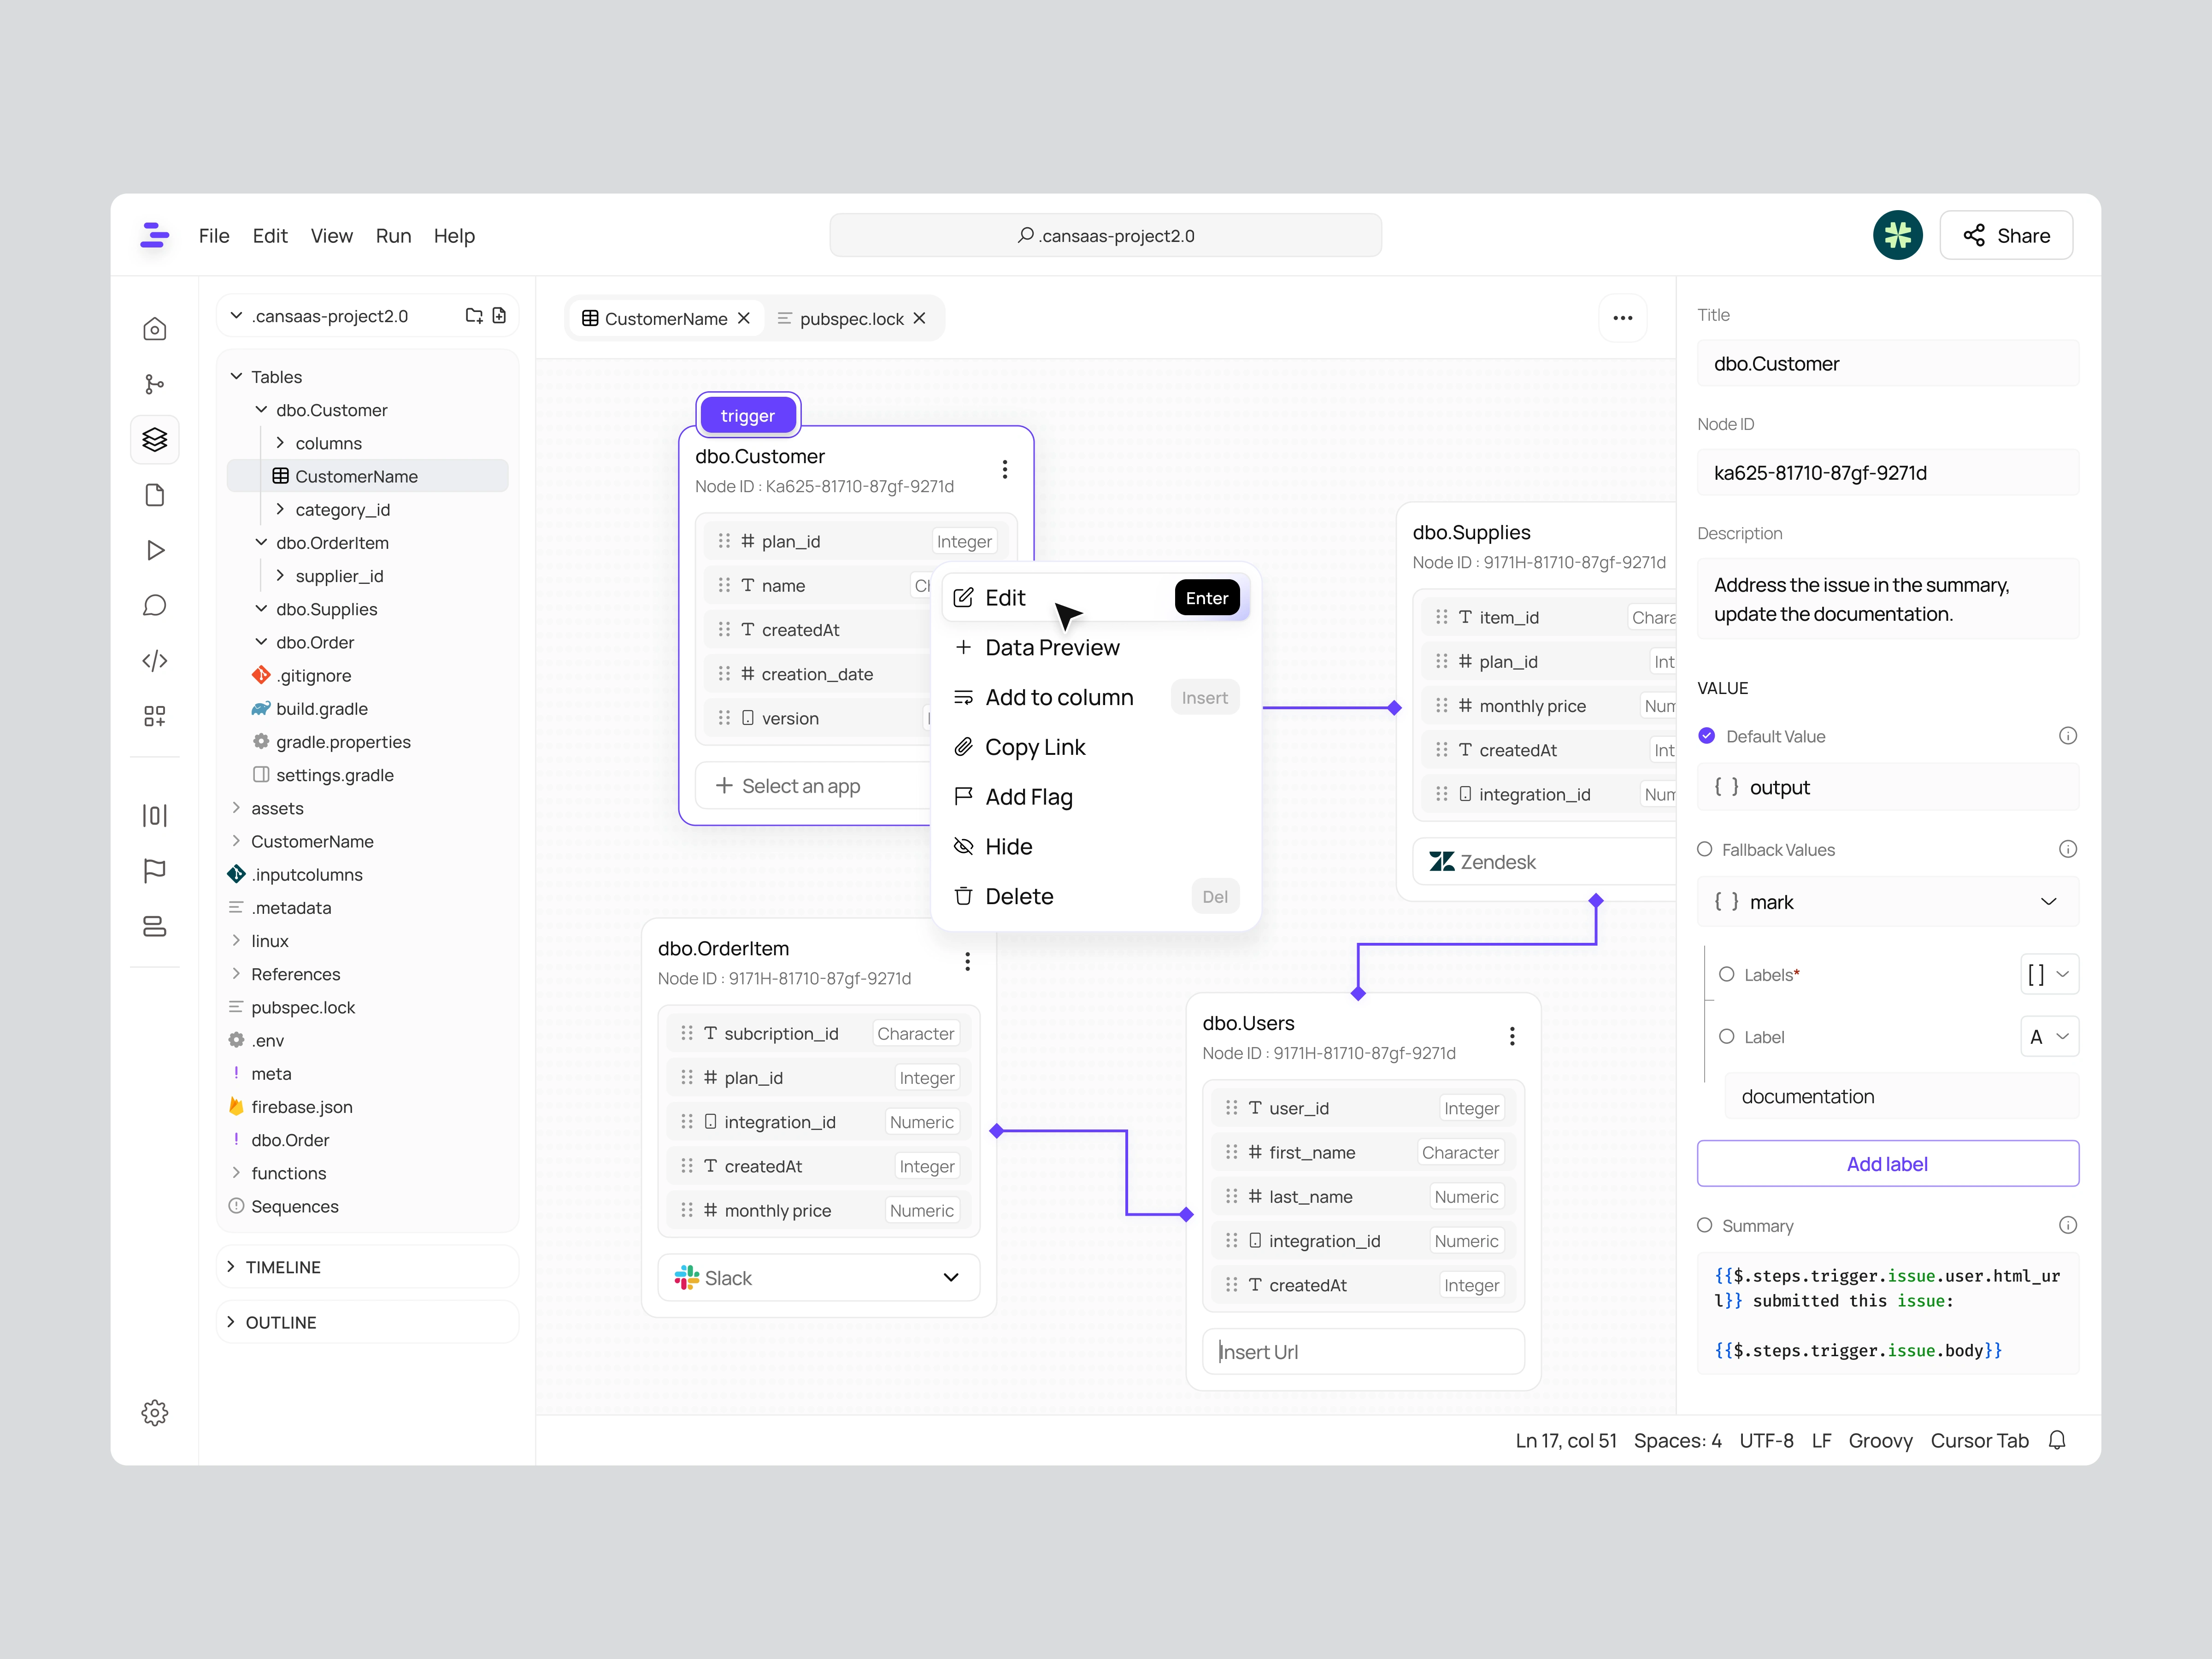
The layout is built with a calm visual system using soft grids, balanced spacing, and strong information hierarchy. Nodes appear as modular cards so relationships remain visually readable and easy to follow. A contextual menu reveals essential actions such as editing, previewing, linking, and flagging with minimal effort. The right panel serves as a centralized inspector that consolidates metadata, configurations, and documentation in one consistent view.
The Solution & Impact
By combining structured navigation, modular node cards, and contextual editing tools, the dashboard improves productivity during schema analysis and data organization. Users can identify relationships faster, troubleshoot issues early, and maintain their data systems with greater confidence. The result is an intuitive and efficient environment for managing complex data ecosystems.
Like this project
Posted Nov 25, 2025
We simplified database relationships by unifying schema mapping, node interactions, and editing tools into one clean workspace.
Likes
1
Views
12