I recently developed an interactive
Ashutosh Mishra
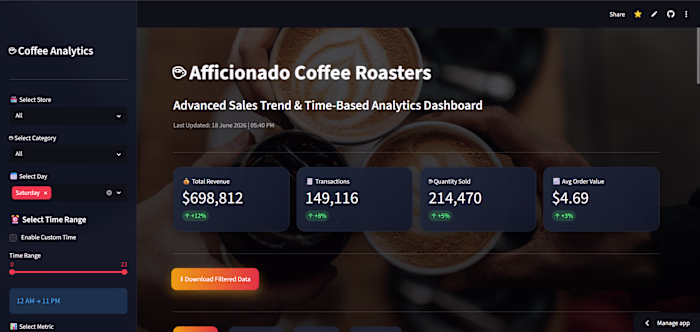
I recently developed an interactive dashboard using Power BI to analyze IPL 2025 player performance. This project focuses on transforming raw cricket data into meaningful insights through visualization and analytics.
🔍 Key Highlights of the Dashboard:
• Player-wise analysis of Runs, Wickets, Strike Rate & Economy
• Identification of Top Batsmen and Bowlers
• Interactive filters (Search Player feature 🔍)
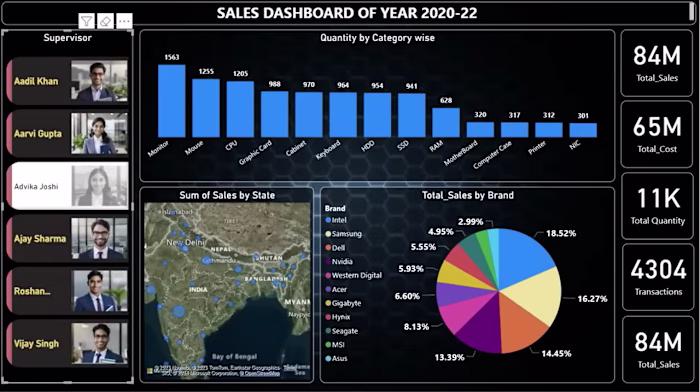
• Visualizations including Bar Charts, Pie Charts & Scatter Plots
• KPI Cards for quick insights
💡 This project helped me strengthen my skills in:
• Data Cleaning & Preparation using Excel
• Data Modeling & Visualization using Power BI
• Creating DAX Measures for analysis
• Designing interactive and user-friendly dashboards
Like this project
Posted Jun 21, 2026
I recently developed an interactive dashboard using Power BI to analyze IPL 2025 player performance. This project focuses on transforming raw cricket data in...