🚀 Here’s a quick look
Ashutosh Mishra
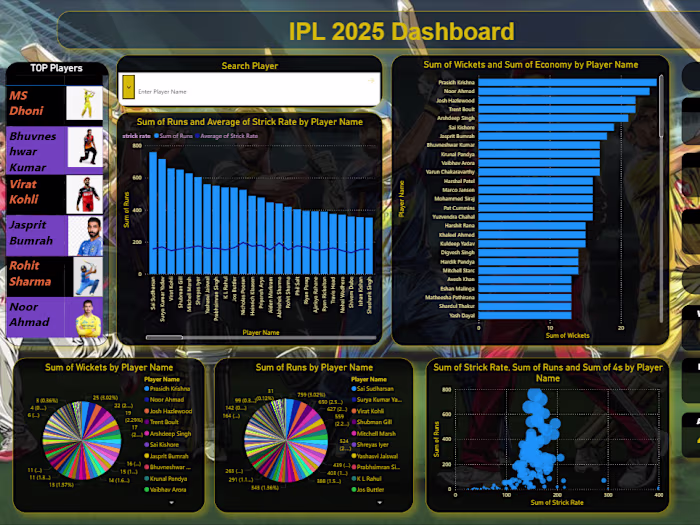
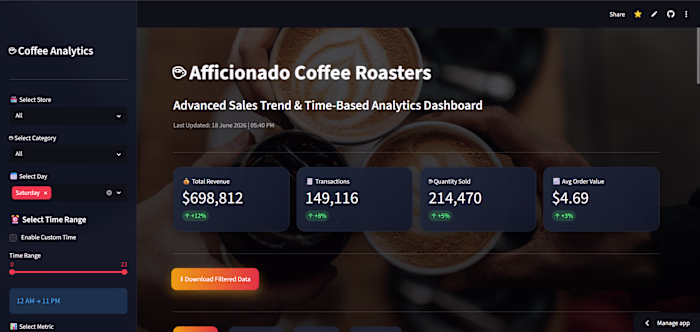
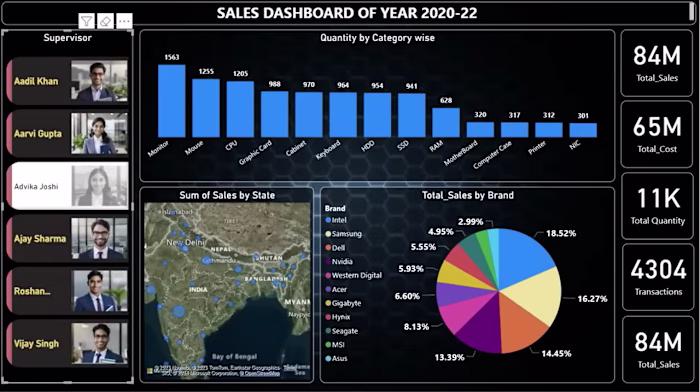
🚀 Here’s a quick look at the UI/UX and working dashboard I designed for our hackathon project MDMS (Machine Dynamics Monitoring System).
🏆 This project helped us win the 🥇 Gold Medal at CODEVISTA v1.0.
💡 What I built:
I designed and developed a multi-page interactive dashboard to monitor machine health (Motor & Generator) in real-time.
⚙️ Key Features:
✔️ Clean and modern UI with smooth animations & hover effects
✔️ Device-based navigation (Motor & Generator dashboards)
✔️ Real-time data visualization using dynamic charts
✔️ Live telemetry simulation (Temperature, Vibration, Current, Power)
✔️ Smart status detection (OK / WARNING / CRITICAL)
✔️ Audio alert system for warning conditions
✔️ Integrity Score & prediction system for machine health
✔️ “Add Device” feature with file input interaction
📊 The dashboard continuously updates data and visually reflects machine behavior, making it easy to detect early signs of failure.
🎯 My focus was to make complex machine data:
➡️ Simple
➡️ Visual
➡️ Easy to understand
This project gave me hands-on experience in UI/UX + Frontend Development + Data Visualization.
Like this project
Posted Jun 21, 2026
🚀 Here’s a quick look at the UI/UX and working dashboard I designed for our hackathon project MDMS (Machine Dynamics Monitoring System). 🏆 This project hel...
Likes
0
Views
2