Super Store Sales Dashboard

Saurabh Shah


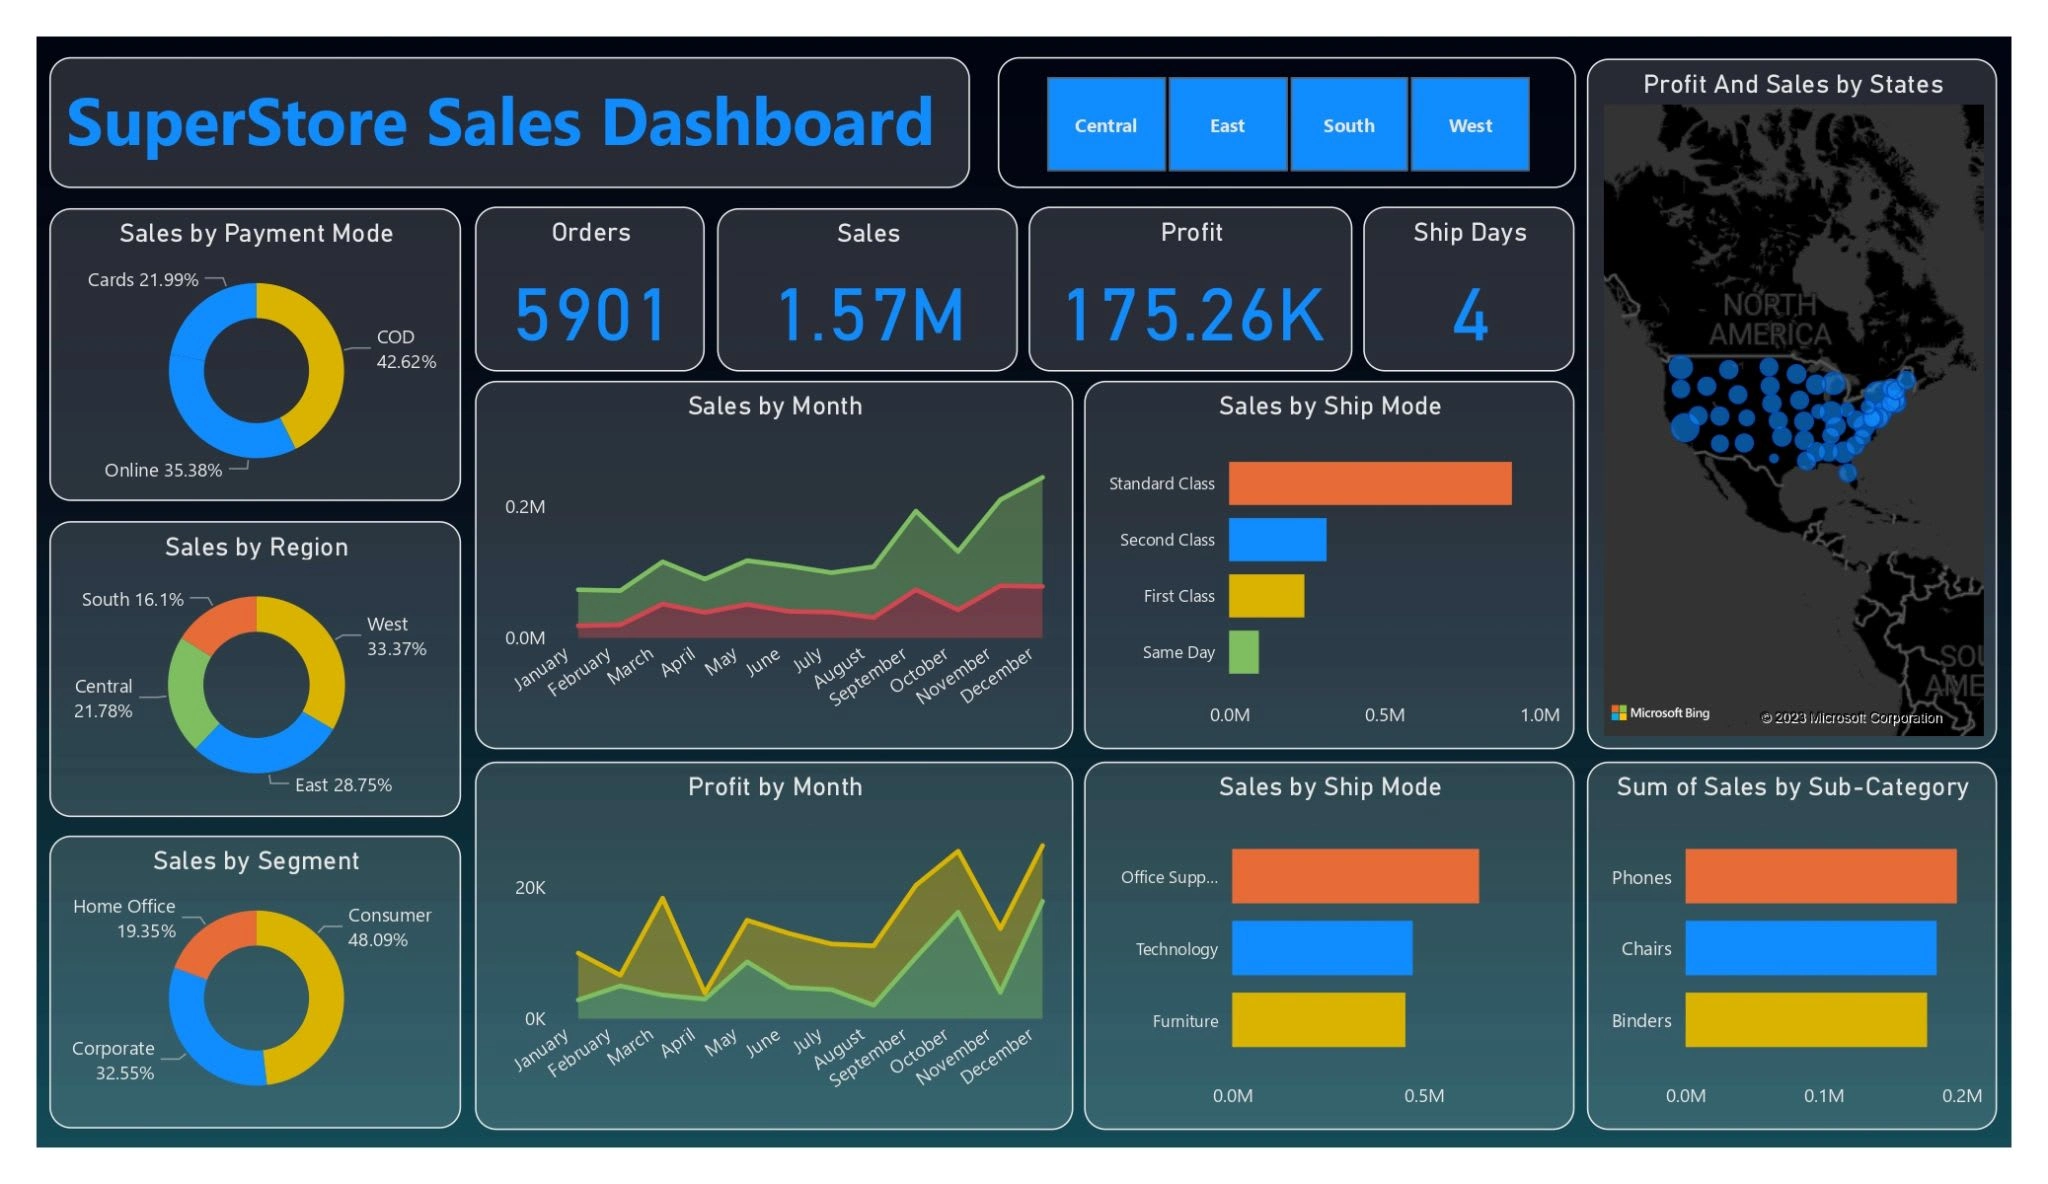
Here is my Dashboard of Super Store Sales.
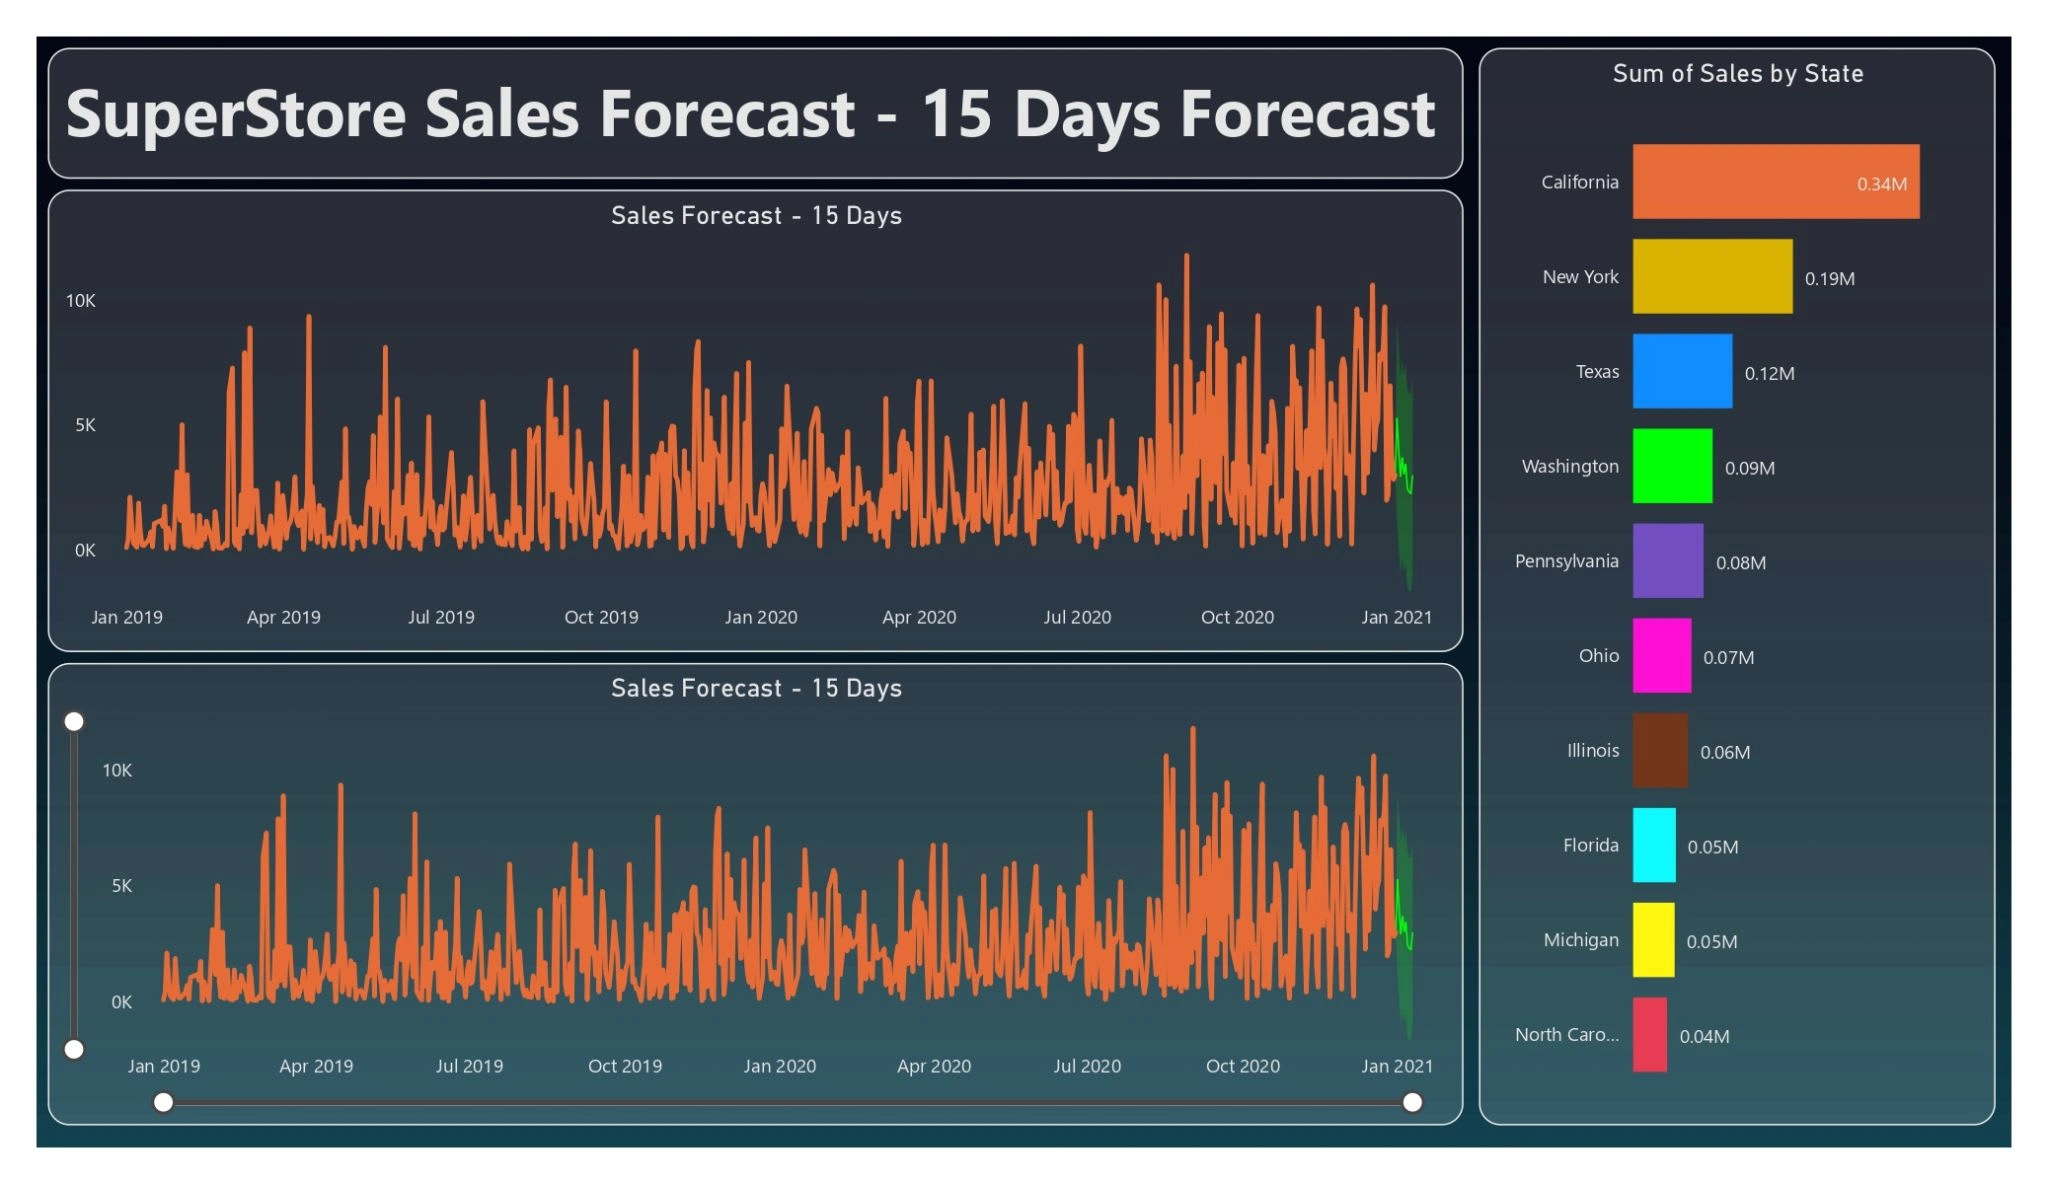
Dashboard objective is to present the sales & profit of superstore by different perspective like Region, Category, Payment mode, Ship Mode etc. and also forecast next 15 days sales using previous data.
In this Power BI project i learn how to import data, clean and process data, design dashboard, use of advance charts and maps, filters and slicers, forecasting in power bi, export dashboard as pdf, project insights and learnings. This is end to end project in Power BI.
steps are followed by
1. Connecting the data to power bi.
2. Cleaning the data in power query (removing nulls and duplicates, conditional column ).
3. Loading into power bi and using dax and measures to get the insight values.
4. Data visualization with different kind of KPIs for better understanding and bar chart, column chart, donut chart etc.
5. Forecast the next days sales using PowerBi forecasting.
learnt using different kind of KPIs and editing in dark background and highlighting the highest values in the matrix .
from here you can access the dashboard :- https://lnkd.in/dwjjfXTX
Like this project
Posted Mar 4, 2024
Crafting a Power BI Super Store Sales Dashboard, incorporating various factors for in-depth analysis and implementing forecasting models for the next 15 days ba
Likes
0
Views
12


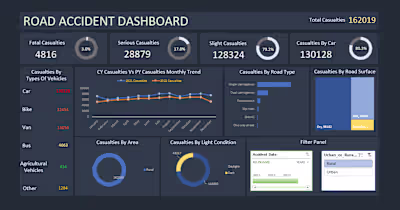
Road Accident Analysis
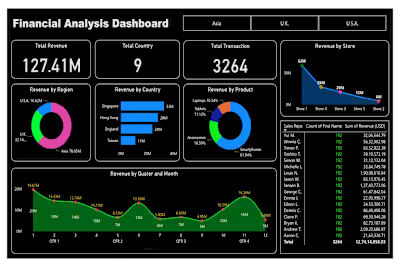
Financial Analysis Dashboard
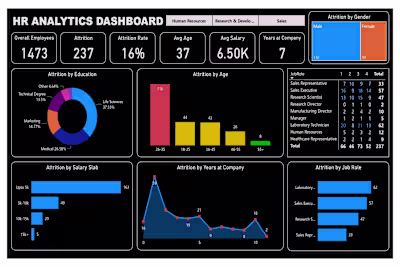
HR Analysis Dashboard