Custom Report Builder for MailChimp
Bryan King
The Problem
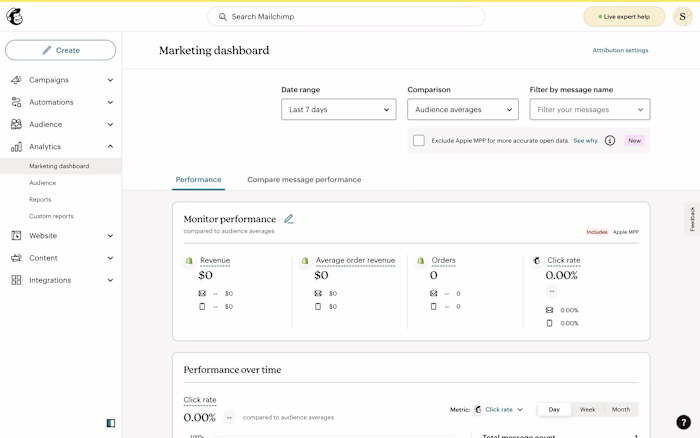
Marketers needed custom reports to answer specific questions about their data—questions the Marketing Dashboard couldn't answer.
Dashboards vs. Reports:
Dashboards: Show how your marketing is doing generally, over time
Reports: Answer specific questions on fixed time periods for recording and communicating outside the system
Example questions:
"How did our July 4th promotion perform compared to Memorial Day?"
"Which audience segments drove the most revenue last quarter?"
"What were total fulfilled orders by email name for Q3?"
Users needed a way to build custom queries, export the results, and share them with stakeholders. The dashboard wasn't built for this—reports were.
The Challenge
Building a visual query builder is straightforward from a UI perspective. The hard part is: Will users understand how to use it?
The conceptual challenges:
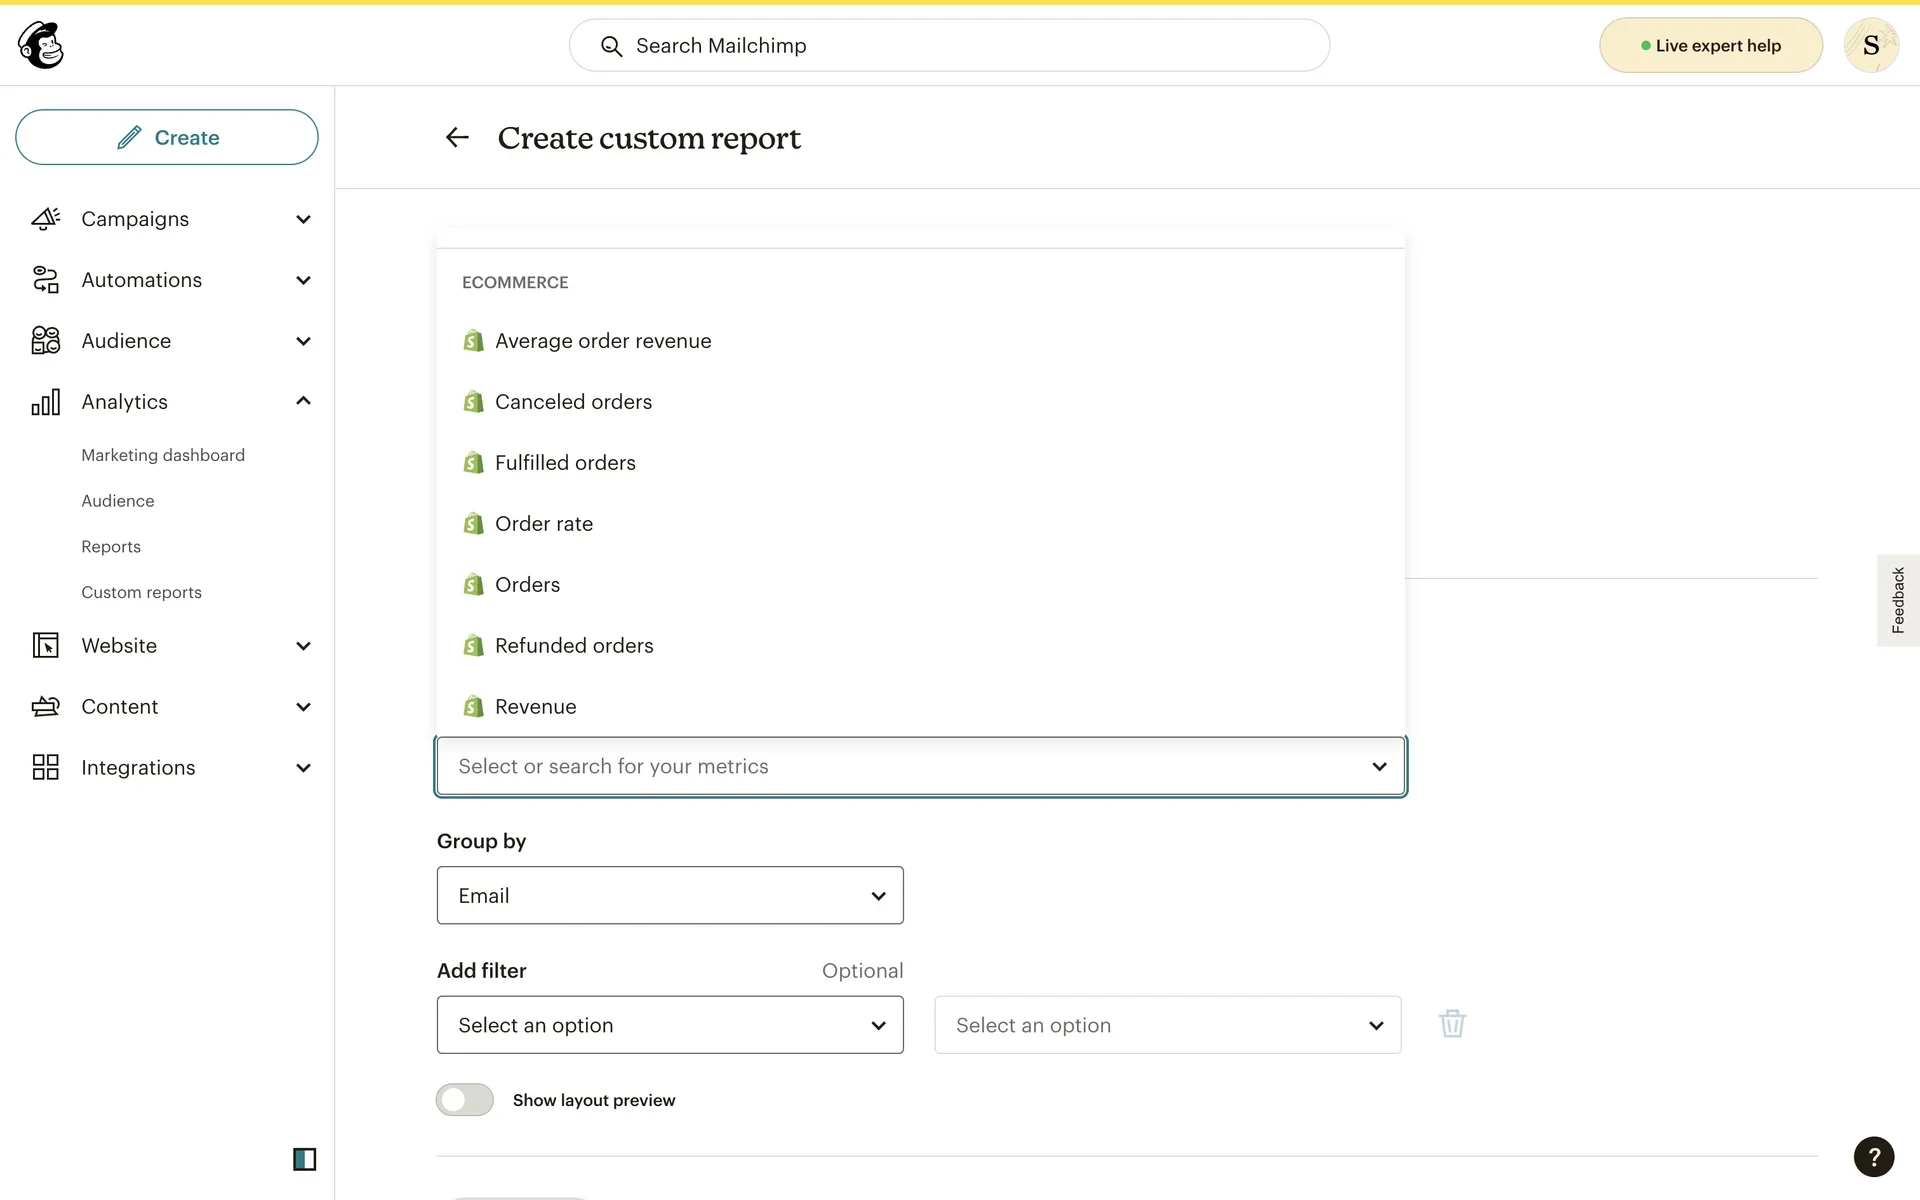
Metrics: Do users understand what metrics are available and what they mean?
Groupings: Can users translate "I want to see performance by audience" into selecting 'Group by: Audience'?
Filters: Do users know when to filter vs. when to group?
Query preview: Can users predict what their report will look like before running it?
The infrastructure problem:
Through discussions with engineers, I learned reports could take 2+ minutes to run—sometimes much longer under load. This meant users couldn't afford trial-and-error. If they built the wrong query, they'd waste minutes waiting, then have to start over.
The critical question:
Can users translate their reporting needs into query logic? If not, we'd build a feature that frustrated users and wasted engineering time.
When Prototypes Need Real Code
In 2022, most designers would have built this in Figma—clickable prototypes with pre-defined paths. But I knew that wouldn't answer the critical question: Can users actually understand how to build a query?
Figma prototypes let users click through predefined flows. But query builders require users to think—to translate their reporting needs into metrics, groupings, and filters. I needed to watch them struggle, succeed, and reveal their mental models in real-time.
So I built a functional prototype in CodePen using HTML, CSS, and jQuery.
Why this mattered:
Real interactions: Users could type, select, and manipulate actual HTML elements
State management: Used localStorage to persist reports—users could create, save, and return to their work
No backend needed: Could test logic without engineering support or production codebase baggage
Authentic behavior: Users revealed their actual thought process, not just which buttons they clicked
Fast forward to 2025: the industry has caught up. Tools like v0, Figma Make, and Lovable are making code prototyping mainstream. Designers are using AI coding assistants (Cursor, Claude Code) to build functional prototypes without traditional engineering support.
I was doing this three years early—but with jQuery and localStorage instead of AI. The principle remains the same: when you need to test logic and behavior, code is the only answer.
User Testing
I collaborated with a design manager to set up unmoderated testing on UserTesting.com. We recruited 10 users matching MailChimp's sophisticated marketer ICP.
Test structure:
Task-based scenarios ("Build a report showing revenue by audience")
Open-ended qualitative questions at the end
Users interacted with the live CodePen prototype
Key questions we needed to answer:
Can users understand how to use the visual query builder?
Do they understand what metrics, groupings, and filters do?
Does the terminology make sense? (especially "Group by")
Does the report preview give users confidence their query is correct?
The Key Finding
Testing validated our visual query builder approach—users understood the mental model and could successfully build reports. But we discovered one critical issue:
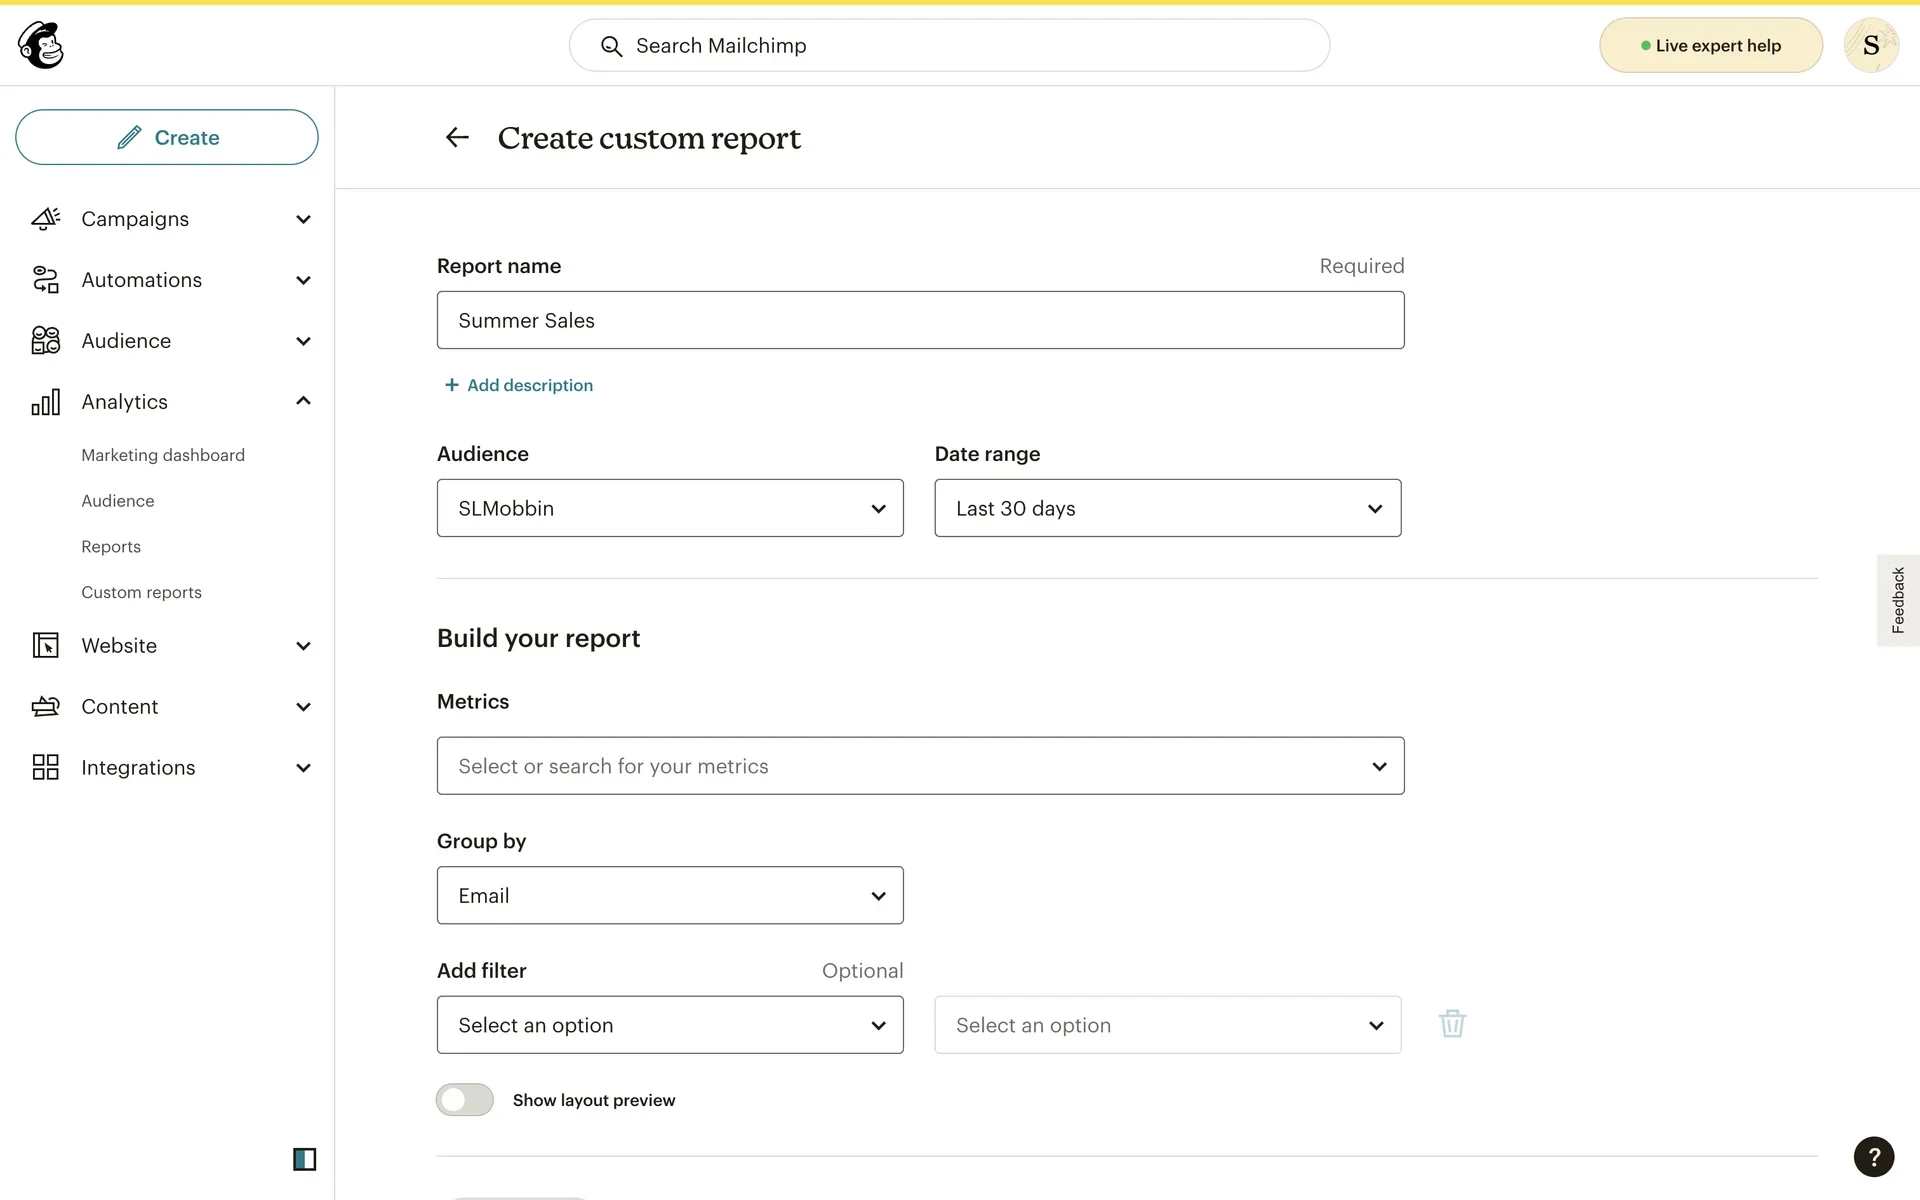
The report preview was hidden behind a toggle.
I had designed a "Show layout preview" toggle that revealed a table showing the row/column structure of the report. My hypothesis was that users would want to preview their query before committing to a 2-minute wait.
The hypothesis was correct—but the preview was too hidden. Users didn't know the feature existed, so they weren't using it to validate their queries.
The change: Show the preview by default. Don't make users discover it.
Why this mattered: Given the 2-minute wait time for reports, users needed confidence their query was correct before running it. Making the preview visible by default ensured every user would see the structure before committing.
The Solution
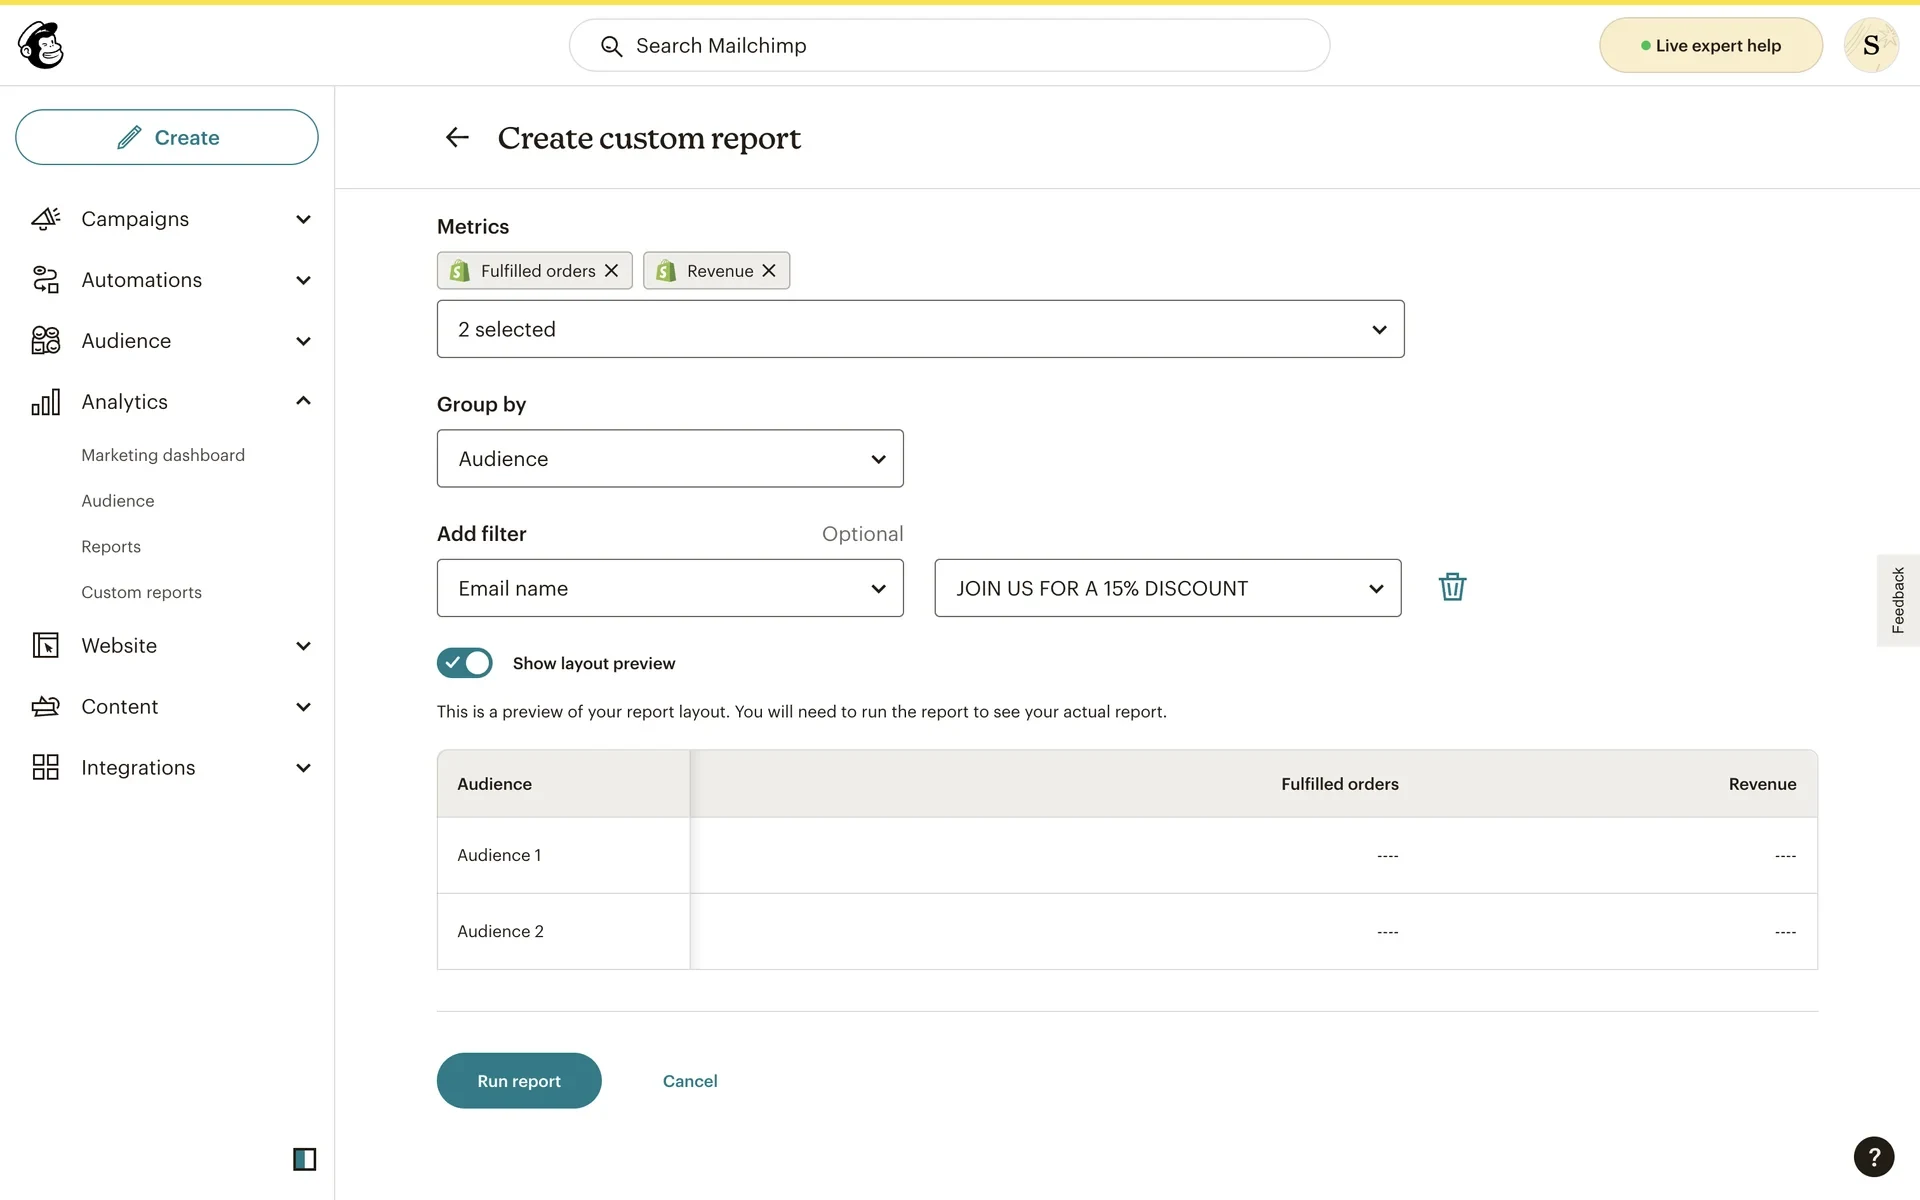
The final design gave users a visual query builder with instant feedback:
1. Report Setup
Name your report
Select audience (which subscriber list)
Select date range
2. Build Your Query
Metrics: Select one or more metrics (opens, clicks, revenue, orders, etc.)
Group by: Choose how to organize your data (by email, by audience, by campaign type)
Add filter (optional): Narrow results to specific emails, campaigns, or conditions
3. Preview & Run
The preview (now visible by default) shows the table structure with column headers and empty rows. This lets users validate their query logic before committing to the 2-minute wait.
When ready, users click "Run report" and the system processes their query.
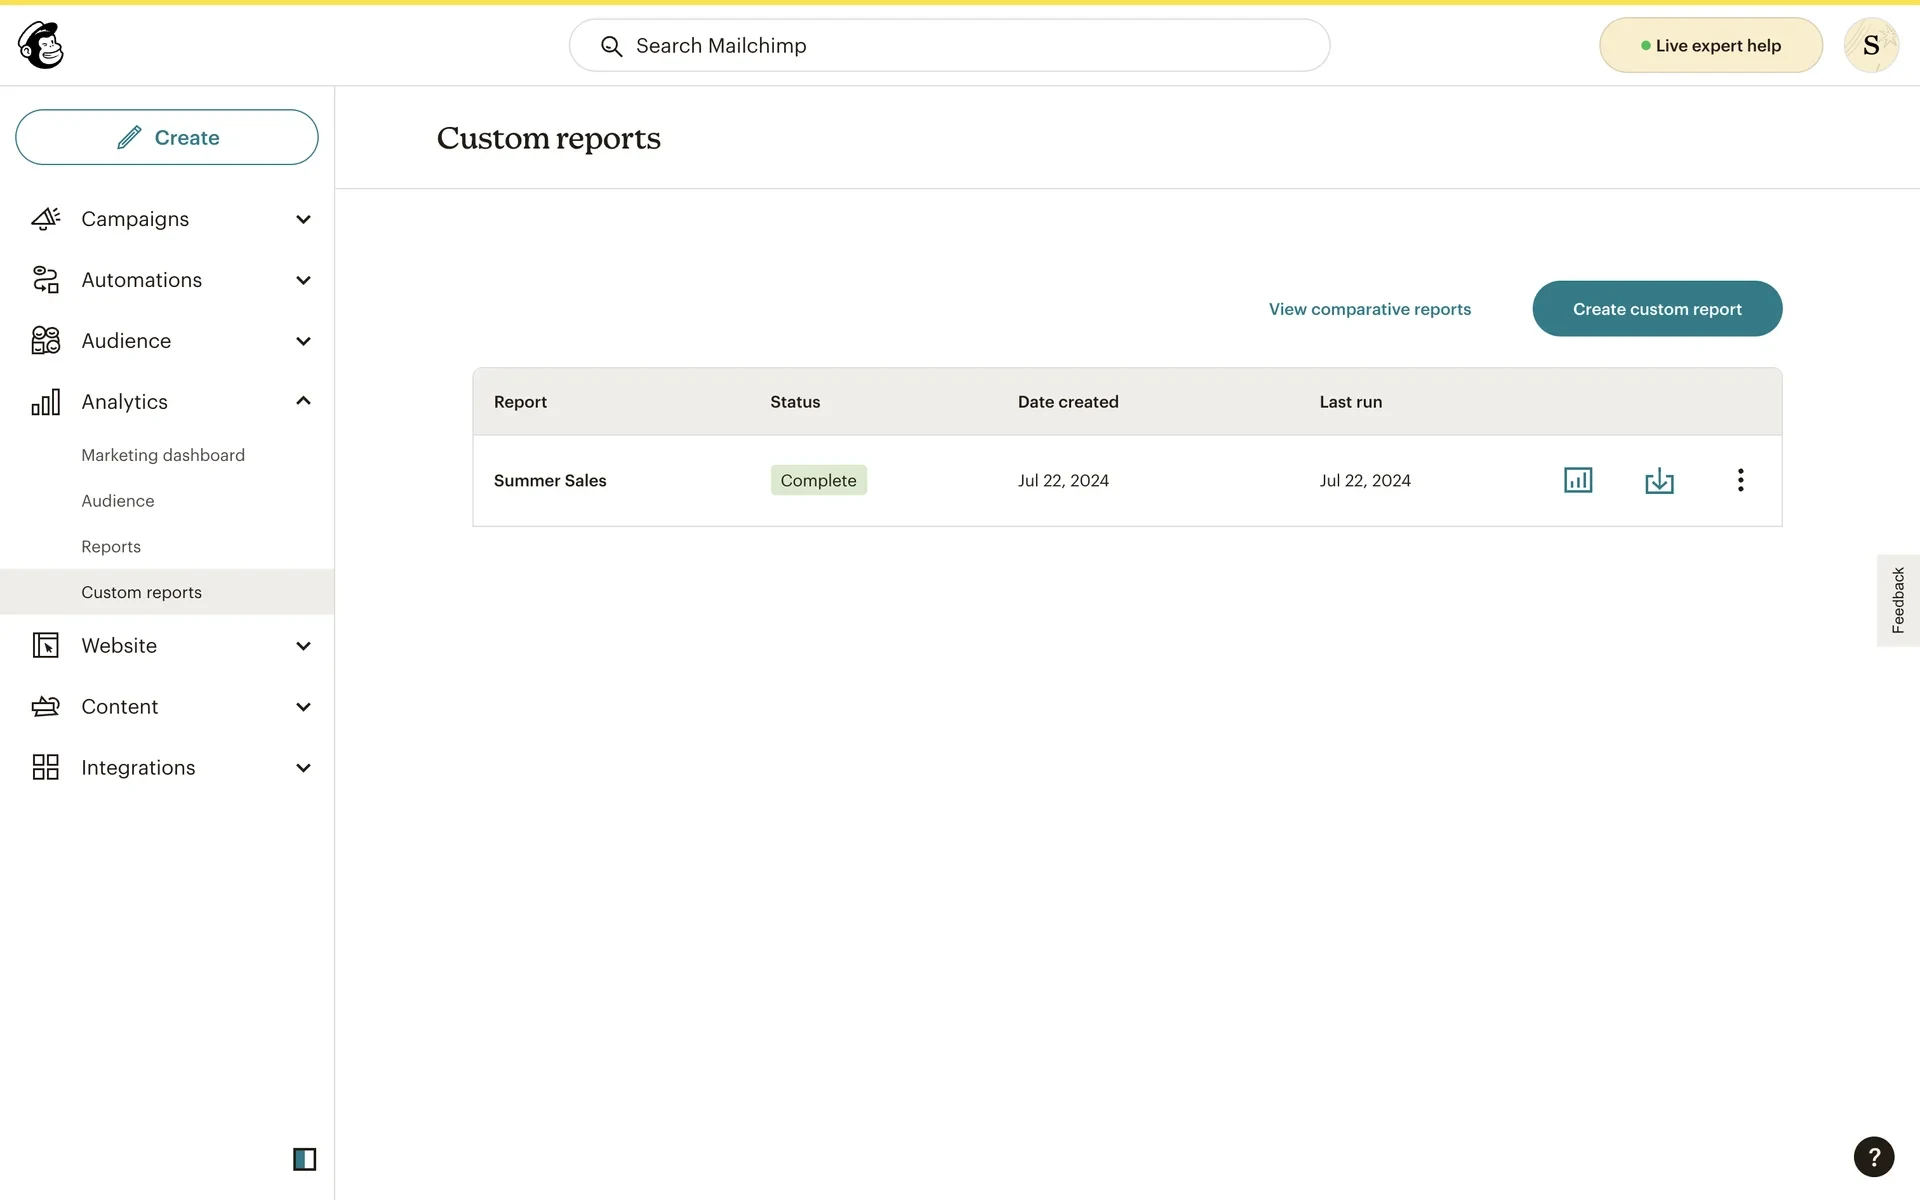
4. Report Management
Users can save reports, re-run them on different date ranges, and access them from a report library.
Impact
The prototype became the blueprint for production.
Custom Reports shipped in early 2023, nearly pixel-perfect to the CodePen prototype—validating that functional prototyping accurately predicted what users needed.
Specific outcomes:
De-risked a 6-month engineering effort: Validated the query builder approach before committing significant resources
Found critical UX issue: Preview needed to be visible by default, not hidden
Guided production implementation: Engineers built almost exactly what I prototyped
Shipped on time: I handed off in December 2022, team shipped in early 2023
One notable change from prototype to production: The "Report type" dropdown in my prototype was removed in production—likely a scope reduction or data architecture decision made after I left.
What I Learned
Prototyping in code answers questions mockups can't.
Figma is incredible for visual design and click-through flows. But when you need to test logic, mental models, and real behavior—code is the answer. I needed to see users actually construct queries, not just follow predefined paths.
Infrastructure constraints should shape design decisions early.
Learning that reports could take 2+ minutes to run fundamentally changed the design. If I hadn't known this constraint, I might not have prioritized the preview feature. Understanding technical limitations early leads to better product decisions.
User testing reveals not just problems, but priority.
The preview feature worked conceptually—users understood it and valued it. The issue was discoverability. This taught me that good features hidden behind clicks might as well not exist. Show users what they need when they need it.
Prototypes that become production prove the methodology.
When production ships nearly identical to your prototype, it validates two things:
your prototype tested the right things
functional prototyping accurately predicted user needs. This is why I prototype in code—it's not just faster iteration, it's more accurate prediction.
Reflection
This project reinforced my belief that designers who can code have a superpower: we can test ideas without waiting for engineering support, and we can answer questions that Figma can't.
In 2022, building functional prototypes in CodePen was unconventional. In 2025, with AI coding tools making this accessible to every designer, it's becoming standard practice. I'm proud I was doing this before it was trendy—and I'm excited to keep pushing this methodology forward.
The fact that production shipped nearly identical to my prototype isn't just validation of the design—it's validation of the process. Functional prototyping works.
Like this project
Posted Dec 20, 2025
How I used a code prototype (instead of Figma) to validate a simple solution to the complex problem of custom report querying
Likes
0
Views
7
Timeline
Sep 1, 2022 - Dec 30, 2022