MailChimp Marketing Dashboard
Bryan King
The Problem
MailChimp users could only view campaign metrics one campaign at a time. There was no way to see overall marketing performance, identify trends, or understand if their email program was working.
Why this mattered:
As MailChimp moved upmarket from "email newsletter tool" to "marketing platform," their user base shifted from hobbyists to professional marketers. Marketers needed to answer questions like:
Is my email program improving or declining over time?
Which campaigns drive the most conversions?
How does this month compare to last month?
What's my overall click rate trend?
The technical blocker:
MailChimp's legacy architecture couldn't support cross-campaign analytics. The company had to migrate to an events-based architecture to make aggregated analytics possible—a massive engineering effort that unlocked this feature for the first time.
Why it had been delayed:
This was MailChimp's most requested feature for over a year, but technical constraints and shifting priorities (Intuit acquisition in September 2021) kept pushing it back. When I joined the analytics team in March 2022 after a post-acquisition reorg, the work was in-flight but needed someone to shepherd it across the finish line.
The Challenge
Context:
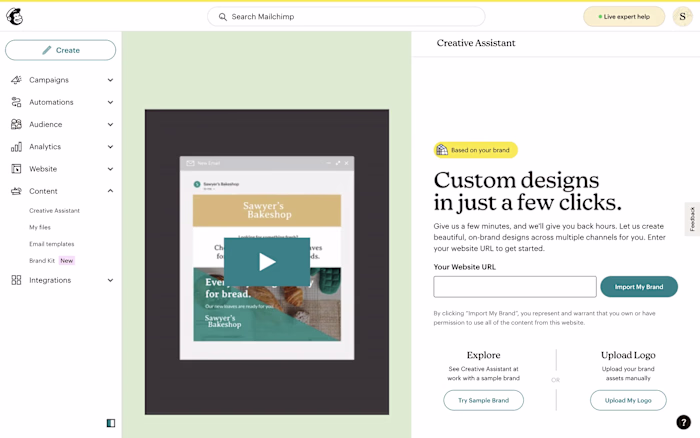
Post-acquisition chaos (Intuit bought MailChimp for $12B in September 2021)
March 2022 reorg moved me from Creative Assistant to new analytics team
I was the only designer for 6-8 weeks (2 new designers joined April/May but needed time to ramp)
Aggressive timeline: Ship by mid-summer
Work was partially in-flight, needed refinement and execution
Design challenges:
Make complex data intuitive: Marketers aren't data analysts—how do we show trends, comparisons, and drill-downs without overwhelming them?
Flexible time comparisons: Users need to compare performance across different time periods
Filter and segment: Users have dozens or hundreds of campaigns—how do they find what matters?
Work within technical constraints: Data infrastructure limitations affected what we could build
My Role
I joined as the first designer on the newly-formed analytics team in March 2022. For the first 6-8 weeks, I was solo—taking work-in-progress and driving it toward shippable quality. Two designers joined in April/May, but I continued leading design execution while they ramped up.
My focus was: refine concepts, coordinate with engineering, understand constraints, and ship on time.
Key Contributions
1. Design Execution & Refinement
I took work-in-progress and made it production-ready:
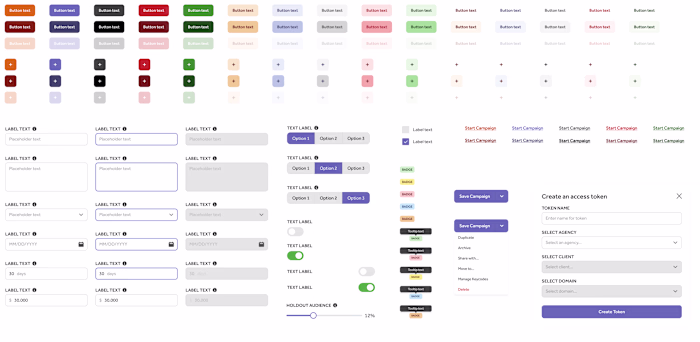
Refined dashboard layout and information hierarchy
Designed metric cards showing performance at a glance
Created trend visualization patterns
QA'd every state: loading, empty, error, partial data, 1,000+ campaigns
2. Working Within Technical Constraints
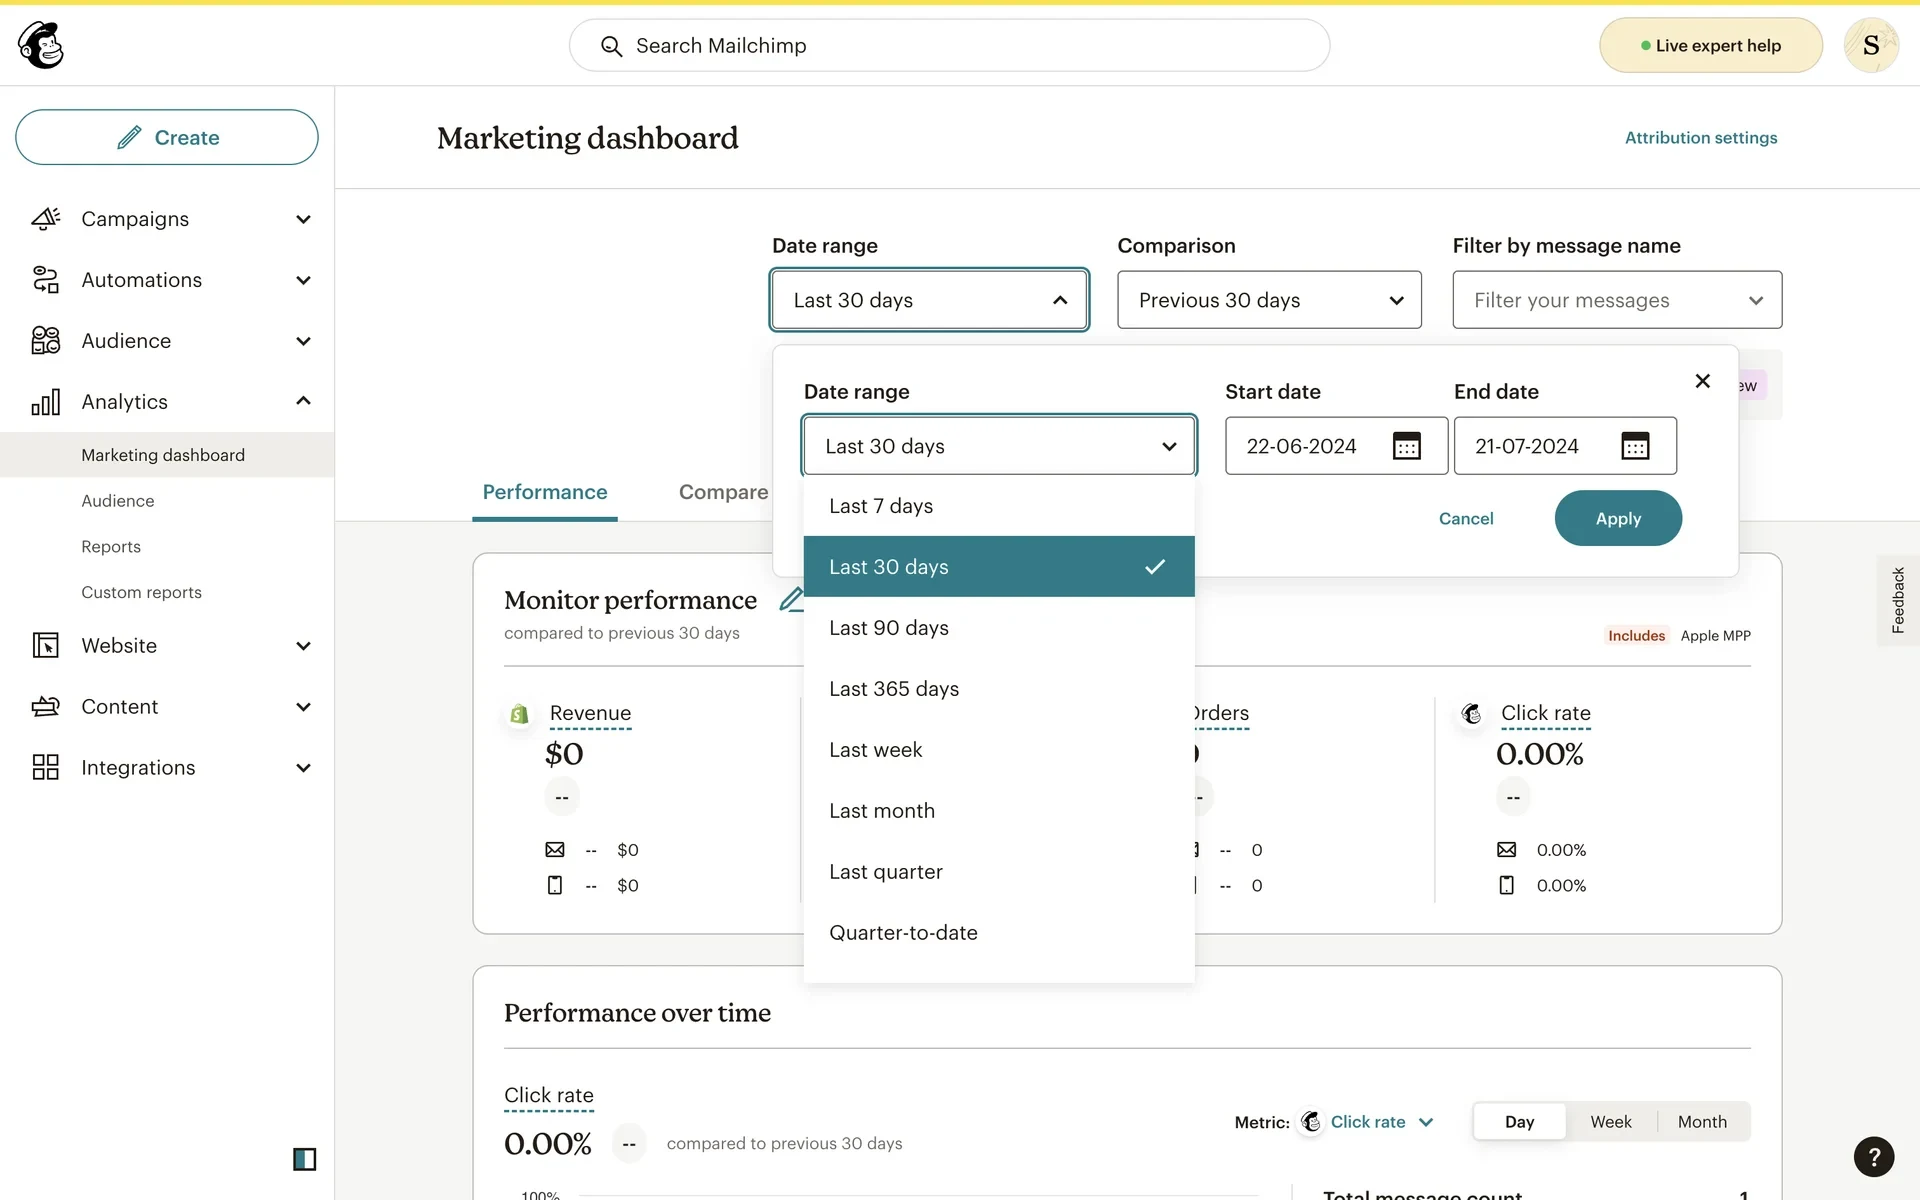
One of my first tasks was designing date range selection. I explored a custom date picker (similar to Airbnb's) that would give users maximum flexibility to select any arbitrary date range.
Through discussions with engineering, I learned our data infrastructure couldn't support complex custom date queries without significant performance issues. The system was optimized for preset ranges, not arbitrary date calculations across millions of campaigns.
I pivoted to a solution that gave users meaningful flexibility within technical constraints:
Preset ranges: Last 7/30/90/365 days, last week/month/quarter, quarter-to-date
Custom date picker for simple ranges (with clear start/end dates)
Smart comparison defaults that matched the selected period
This taught me that good product design isn't just about ideal user experience—it's about understanding what's technically feasible and designing the best solution within real constraints.
3. Cross-Functional Bridge
My engineering background made me an effective bridge between design and technical teams:
Translated design concepts into technical feasibility
Worked with PM to scope features realistically
Coordinated with engineers to refine interaction patterns
Participated in technical discussions about data architecture
This collaborative approach meant fewer surprises during implementation and faster iteration cycles.
4. User-Centered Refinement
As we approached launch, I participated in UX research sessions led by our researcher and PM. I sat in on user testing to:
Understand how marketers think about performance analysis
Validate design decisions with real users
Identify refinements needed before launch
Ensure the dashboard served both power users and casual users
These insights informed final refinements and helped us prioritize what mattered most to users.
What Shipped
The Marketing Dashboard launched in July 2022 with three core capabilities:
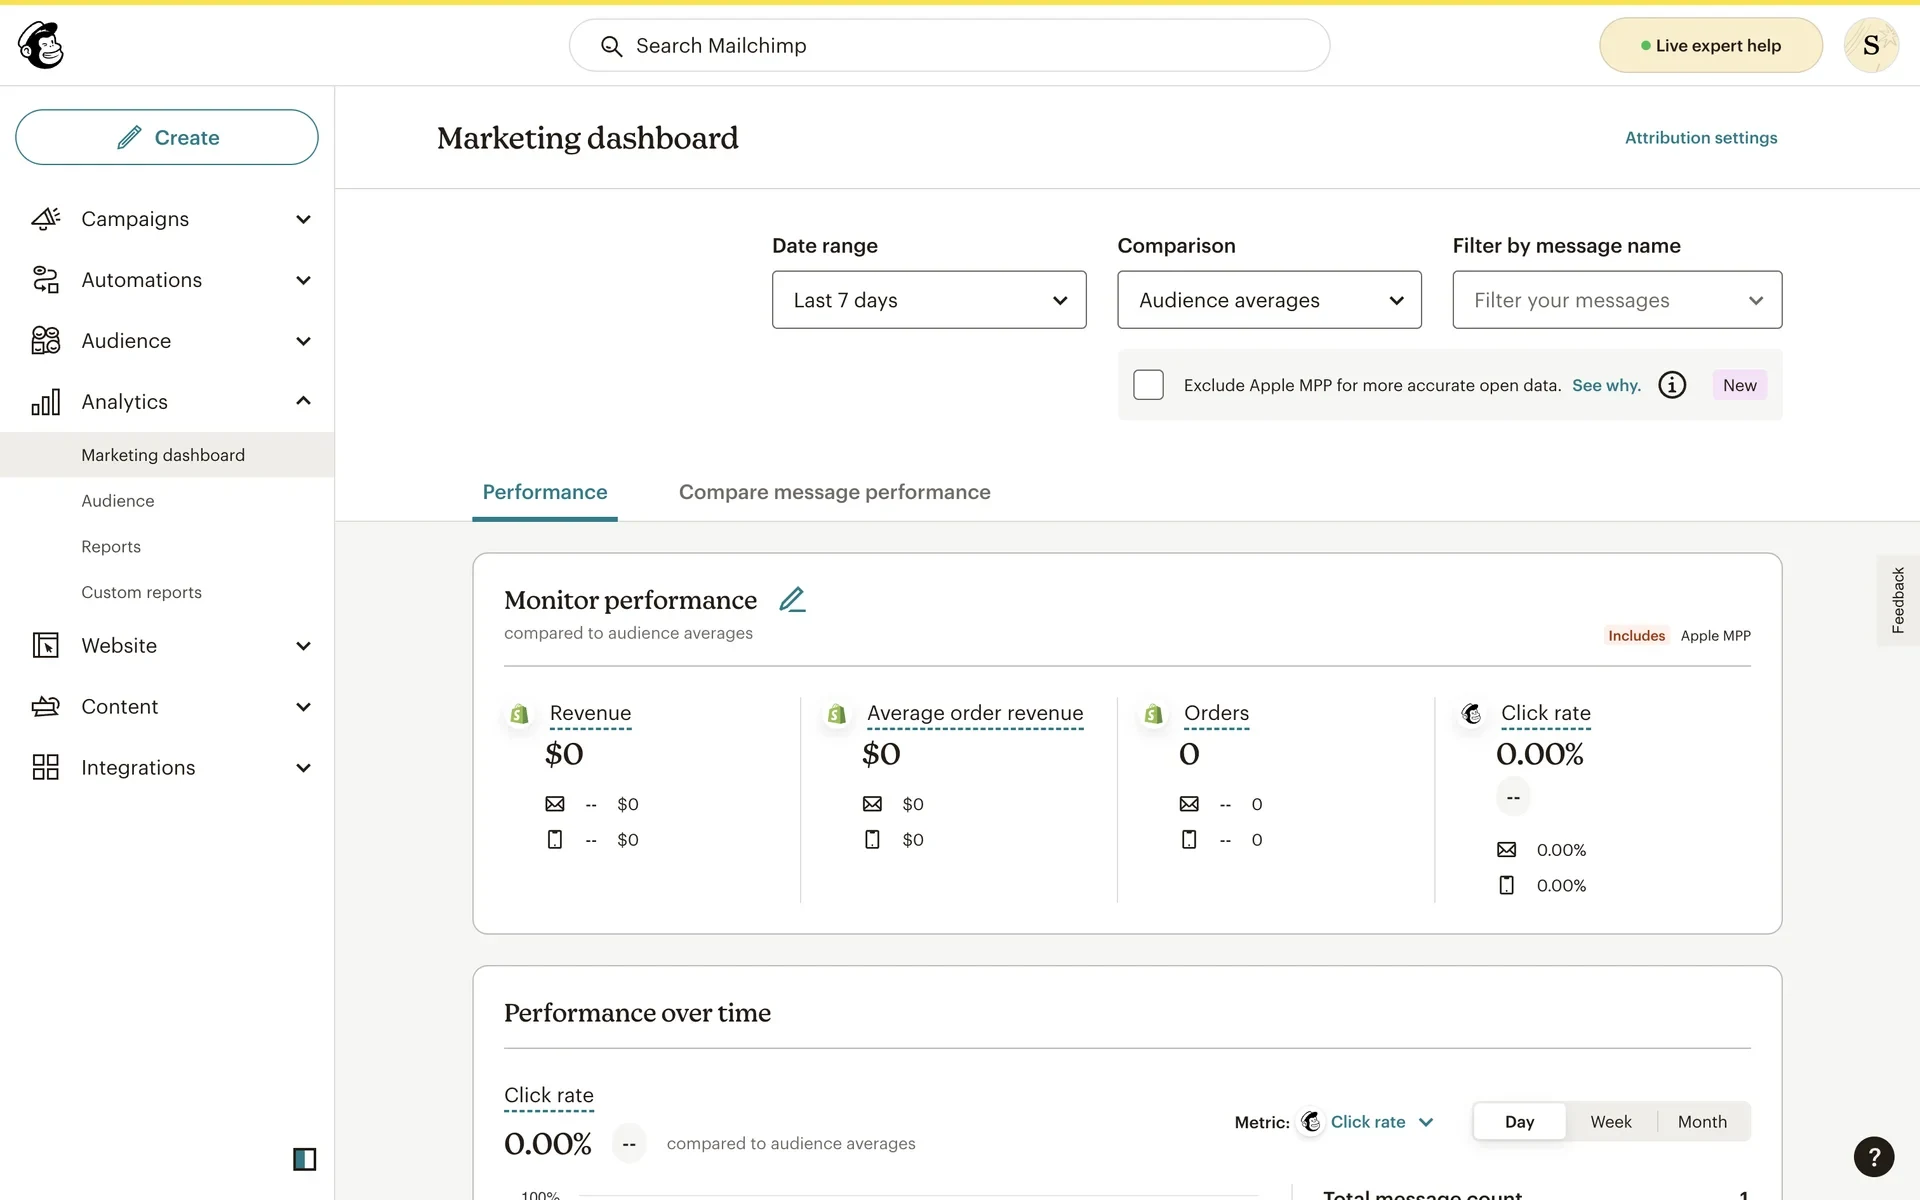
Monitor Performance
Key metrics displayed prominently:
Revenue (total and average per order)
Orders
Click rate
Email/SMS breakdown for each metric
Visual indicators showing up/down trends
Marketers could immediately see if performance was improving or declining without digging through individual campaigns.
Flexible Comparison Logic
Users could compare performance in two ways:
Previous period: Compare last 7 days to previous 7 days, or last month to previous month
Audience averages: Compare your performance to typical results for your audience size
This answered the core question: "Am I getting better or worse?"
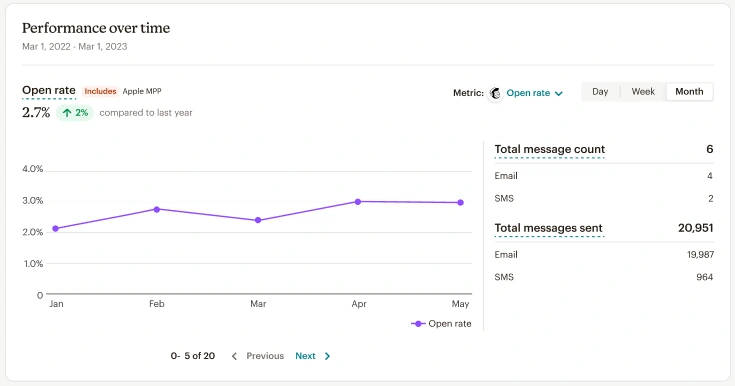
Performance Over Time
Trend visualization showing:
Line charts for any metric over time
Granularity controls (Day, Week, Month views)
Metric selector to switch between click rate, opens, revenue, etc.
Filter by message name to isolate specific campaigns
This revealed trends that single data points couldn't show—seasonality, campaign fatigue, improving engagement.
Impact
Immediate results:
Shipped on time in July 2022 despite post-acquisition chaos
Launched to 13M+ MailChimp users
Delivered the company's most requested feature after over a year in backlog
No major bugs or user confusion at launch
Strategic validation:
Within weeks of launch, the Marketing Dashboard became the default landing page for MailChimp's analytics section—replacing the campaign list as the primary entry point. This signaled MailChimp's evolution from "email service provider" to "marketing platform."
The PM told me this was the smoothest analytics launch the team had ever done. It became the template for how the analytics team approached future features.
Continued evolution:
After the initial launch, the team continued building on this foundation:
I worked on dashboard customization (user-configurable widgets)
Other designers tackled audience analytics and design system enhancements
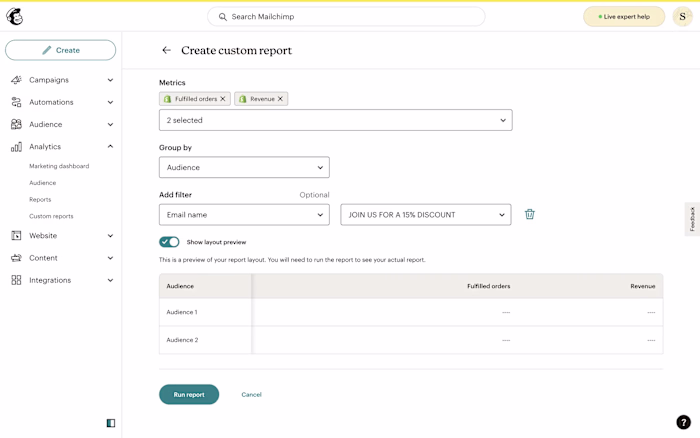
Custom reports feature (which I had prototyped) moved forward
The dashboard became foundational to MailChimp's entire analytics strategy.
What I Learned
Design execution is as important as design vision.
Someone has to drive work across the finish line. During the critical 6-8 weeks I was solo, I learned that execution leadership means: making pragmatic decisions, keeping teams aligned, and shipping on time—not just having good ideas.
Technical constraints aren't limitations—they're design parameters.
The date picker challenge taught me that understanding infrastructure constraints early leads to better product decisions. I could have pushed for my ideal solution and delayed the launch by months. Instead, I designed within constraints and shipped on time.
Being the bridge between design and engineering is a superpower.
My engineering background let me participate in technical discussions, understand trade-offs, and propose realistic solutions. This made me a more effective designer and a more valuable team member.
Shipping during chaos requires focus, pragmatism, and collaboration.
Post-acquisition reorgs are messy. Teams change, priorities shift, and timelines compress. The designers who succeed are the ones who stay focused on shipping, make pragmatic trade-offs, and build trust through collaboration—not perfection.
Reflection
This project taught me that designing for marketers during a platform transition means respecting both where they are (simple campaign metrics) and where they're going (sophisticated performance analysis). We couldn't just dump enterprise analytics features on small business users—we had to make complexity optional, not mandatory.
Looking back, I'm proud that we shipped MailChimp's first aggregated analytics in an aggressive timeline during organizational chaos. But more than that, I'm proud of how I showed up: as a design execution leader who could bridge technical constraints, collaborate across functions, and deliver under pressure.
The work I did here became the foundation for MailChimp's entire analytics strategy. That's the kind of impact I want to keep creating: features that don't just ship, but become foundational to the product.
Like this project
Posted Dec 20, 2025
Designed and executed MailChimp's Marketing Dashboard amidst post-acquisition chaos, enhancing user analytics capabilities.
Likes
0
Views
4
Timeline
Apr 1, 2022 - Jul 31, 2022