OT Security Dashboard Prototype

Diana Aya


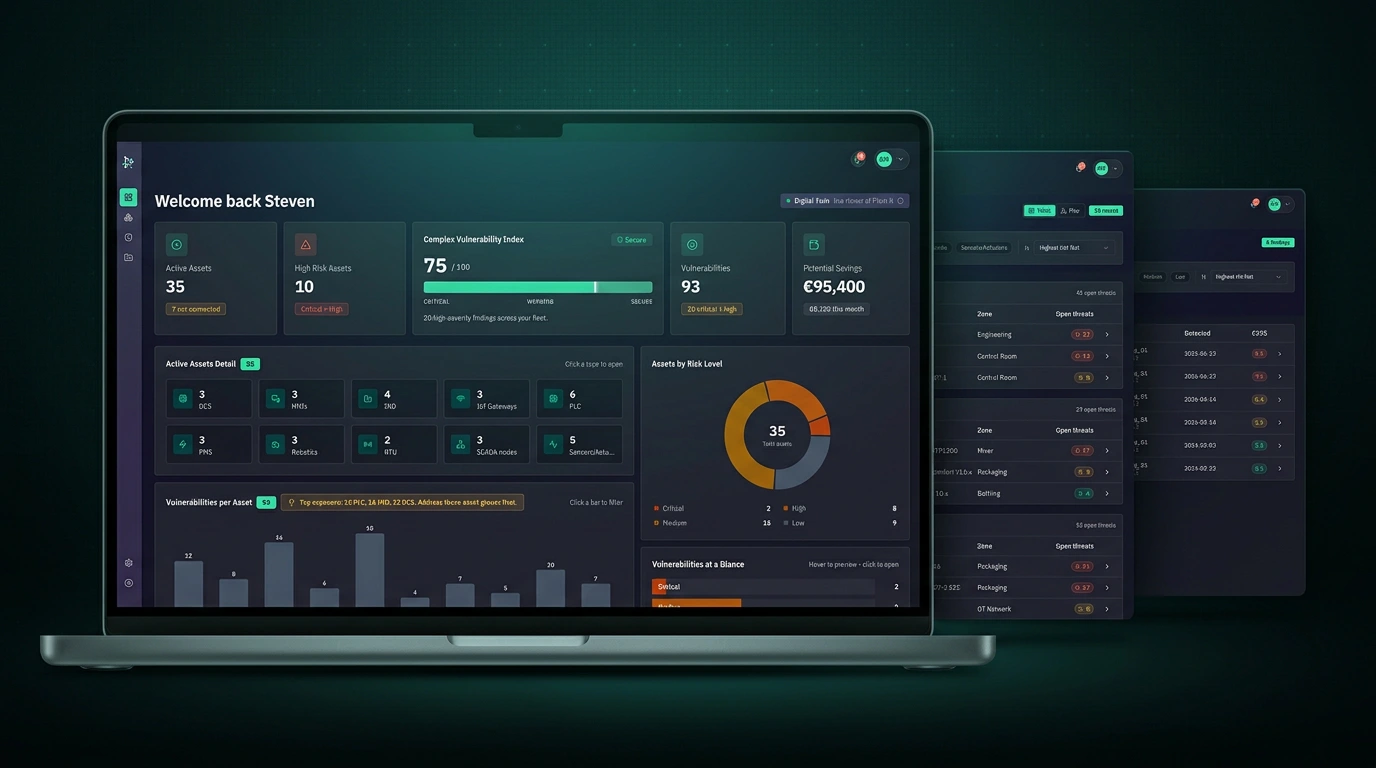
Dashboard-first prototype for a digital twin security tool, where security teams could review vulnerability data, asset inventories, and pen test findings for industrial (OT) environments. I prototyped it in Lovable to get something clickable in front of real industry experts fast, instead of waiting months for an engineering build just to test the idea.
What I built
Dashboard: posture at a glance, active assets, high-risk count, vulnerability exposure score.
Assets: full device inventory, viewable as a table or a network map, each one clickable through to its specific vulnerabilities.
Vulnerabilities: a prioritized, searchable list of findings, rated by severity, always traceable back to the exact device.
Reports: pen test history showing which tests ran and what they found.
Validation
We tested the prototype with 22 industry experts in moderated UX sessions using real tasks, observing where they hesitated or asked for clarification, especially regarding information density. It closed out with a System Usability Scale (SUS) score of 64, within the 60-65 industry norm for data-heavy enterprise and security tools.
Have a project in mind?
Contact me to know more.
Like this project
Posted Jul 8, 2026
UX prototype for a B2B security platform: dense, data-heavy, built for industrial cybersecurity professionals, not casual users.
Likes
0
Views
5
Timeline
Nov 30, 2024 - Jan 9, 2025