One dashboard for a nine-project AI operation

Jessy Mariau


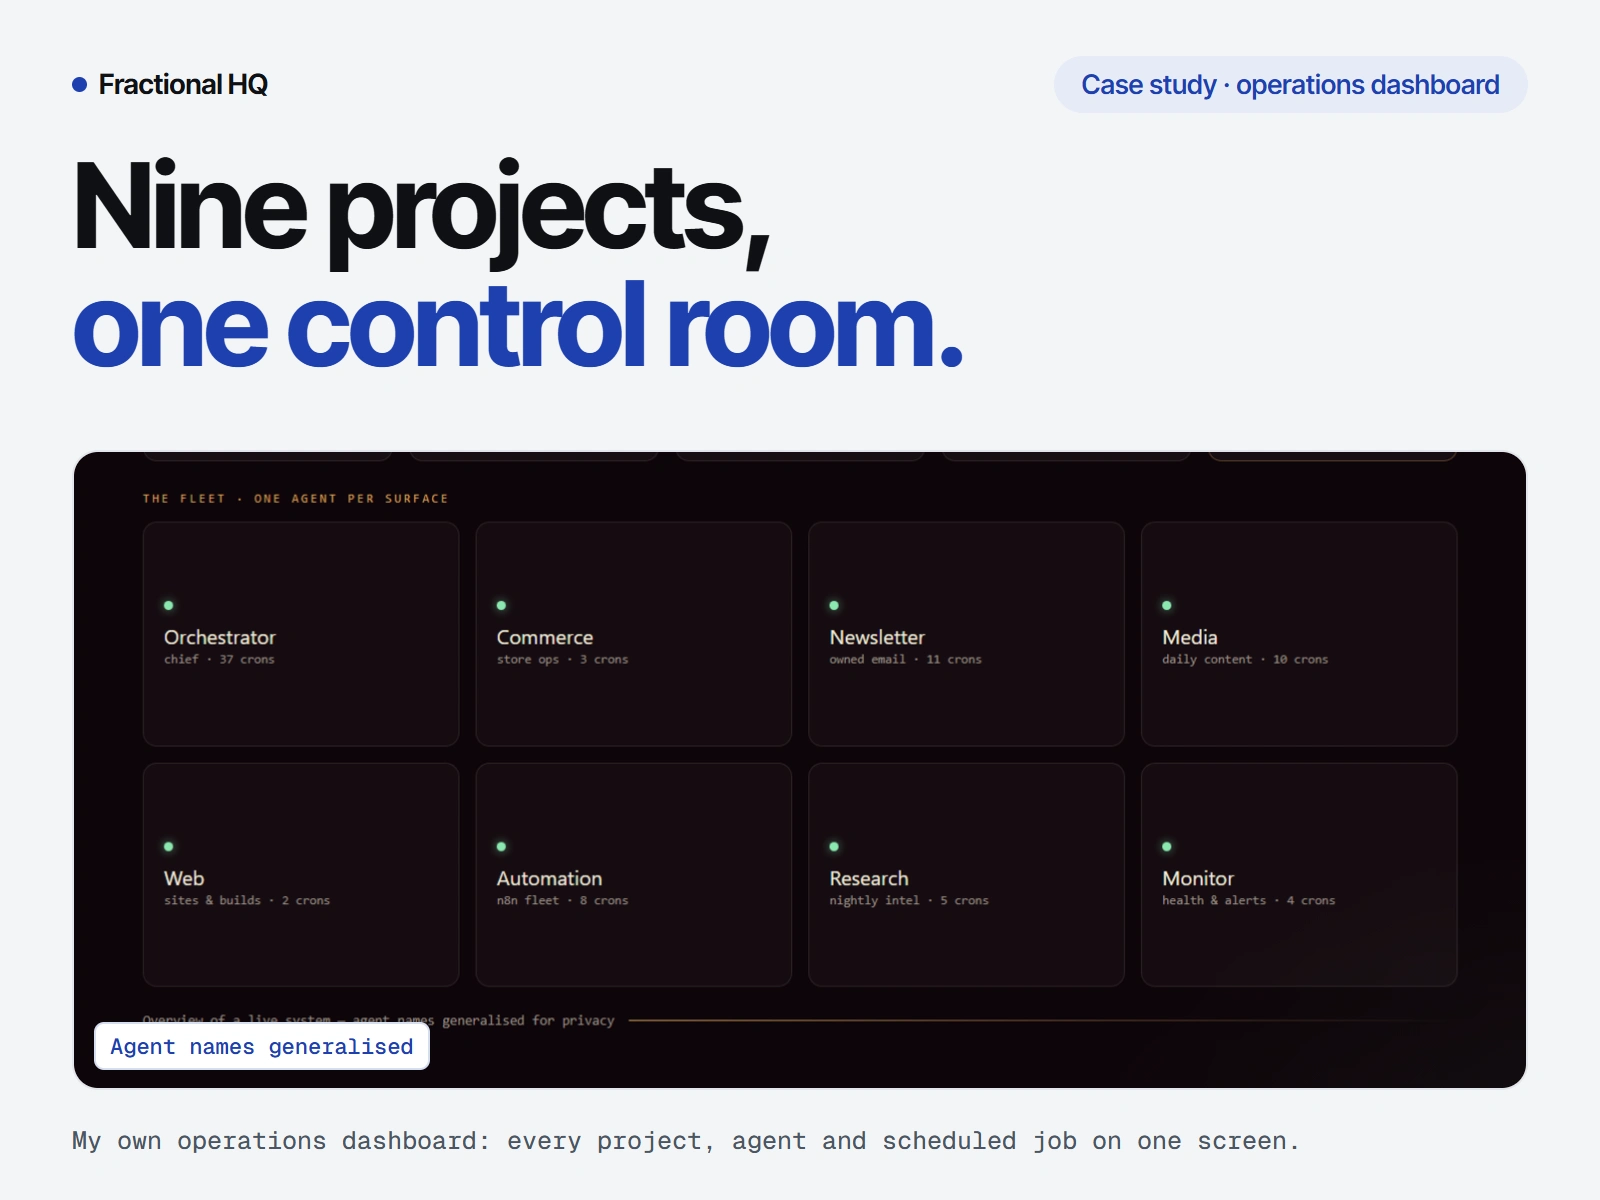
Nine projects, one control room
I run nine projects with a fleet of AI agents. The hard part was never a single project. It is seeing the whole operation at once: who did what, what is running now, and what is quietly stuck.
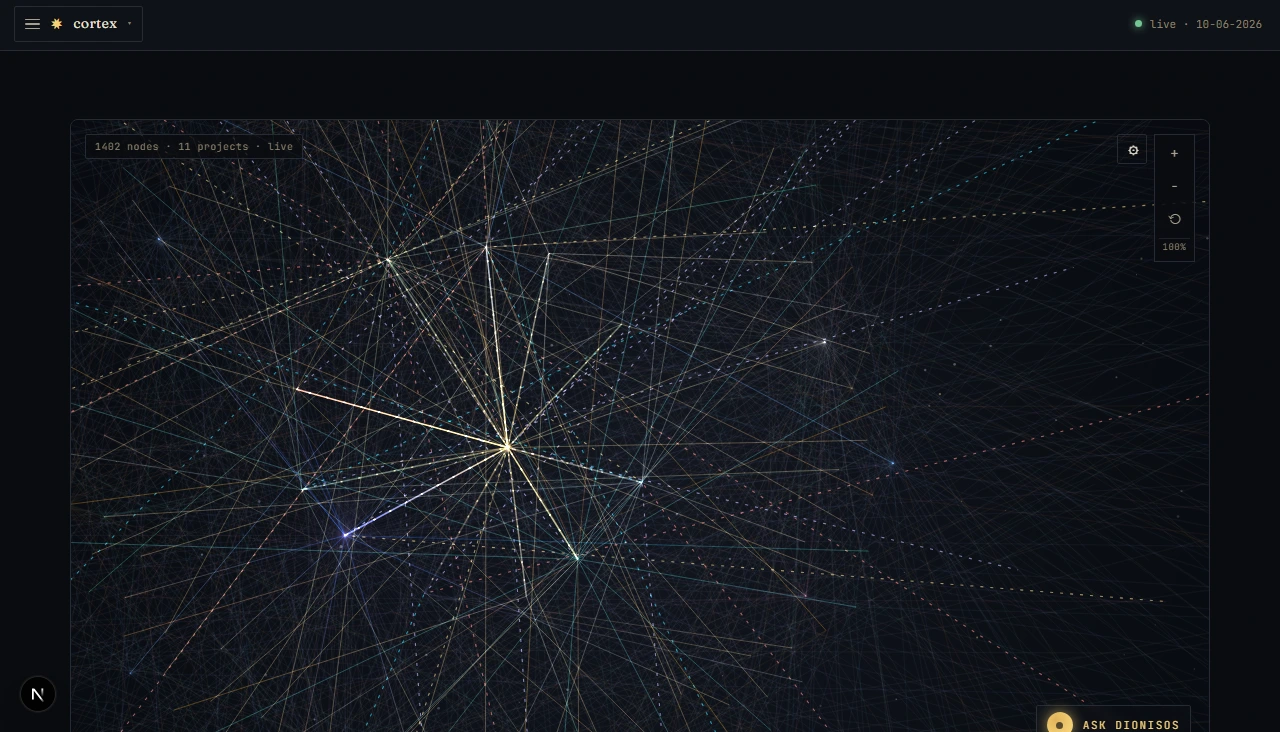
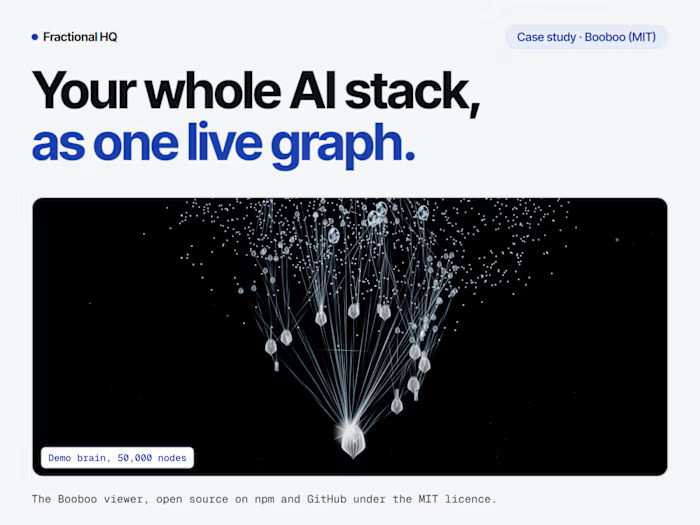
The operation as one live graph
The operation has a cockpit
A realtime dashboard on Next.js and Supabase puts every project, agent, scheduled automation and memory bucket on one surface, with a push to my phone when something actually needs me. The org chart doubles as the structure the agents boot from, so reshaping it changes the next run.
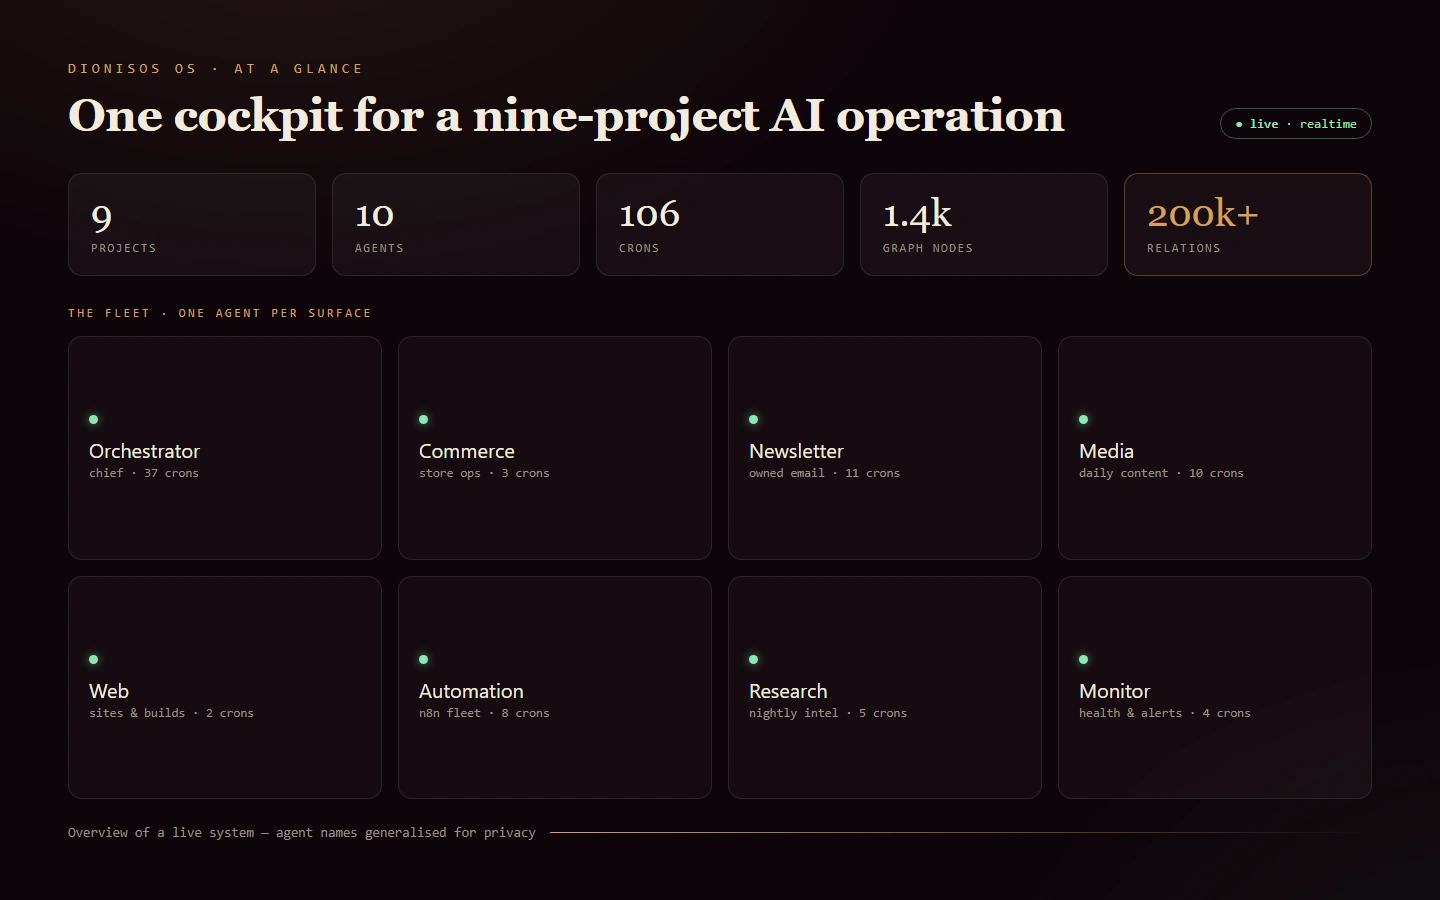
One agent per surface, at a glance
What it holds, read on 20 September 2026
Nine active projects and 17 agents. 147 scheduled automations registered, 25 of them switched on. A memory store of 16,236 entries, and a knowledge graph of 172,714 entities and 266,429 relations built from 28,517 documents. Every figure here was read from the live tables the day this was written, and the screenshots carry their own numbers from the day they were taken.
The dashboard itself sits behind a login, because it holds live business data, so these screenshots are the view. Agent names in the overview are generalised for the same reason. My own operation runs on this system every day, and I would build yours the same way.
Like this project
Posted Jul 12, 2026
Nine projects, one control room. Every agent, scheduled job, task and alert across the operation reports into a single live dashboard, so one screen answers what is running right now.
Likes
0
Views
16