Interactive-Sales-Dashboard-with-Power-BI


Interactive Sales Dashboard
📌 Project Overview
This interactive Power BI dashboard provides an in-depth analysis of sales performance, helping businesses track revenue trends, identify top-selling products, and optimize sales strategies. It offers dynamic visualizations, enabling data-driven decision-making.
🚀 Features
Sales Performance Analysis: Tracks revenue, profit margins, and sales growth.
Interactive Visualizations: Filterable and drill-through reports for detailed insights.
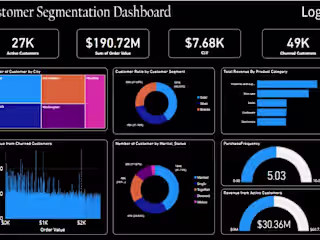
KPIs & Metrics: Displays total sales, top customers, regional performance, and sales trends.
Data-Driven Insights: Helps businesses optimize sales strategies and improve profitability.
🖥️ Screenshots
📊 Dashboard Preview
(Replace with actual image link)
📂 Project Structure
📥 Installation & Usage
Clone the Repository:
Open the Power BI File:
Open
Sales_Dashboard.pbix in Power BI Desktop.Explore the Dashboard:
Use interactive filters to analyze sales trends.
Modify and customize based on business needs.
📌 Requirements
Power BI Desktop (Latest Version)
A dataset containing sales transactions, product details, and customer data
📜 License
This project is licensed under the MIT License – see the LICENSE file for details.
🙌 Connect With Me
🔗 GitHub: github.com/yisakfikre
🔗 LinkedIn: linkedin.com/in/yisak-fikre-b806361bb
🚀 Feel free to contribute, open issues, or reach out for collaborations!
Like this project
0
Posted Jan 19, 2025
This interactive Power BI sales dashboard provides e-commerce businesses with actionable insights to optimize performance and drive growth


Customer Segmentation Interactive Dashboard

Sales Analysis for E-commerce Business Using SQL