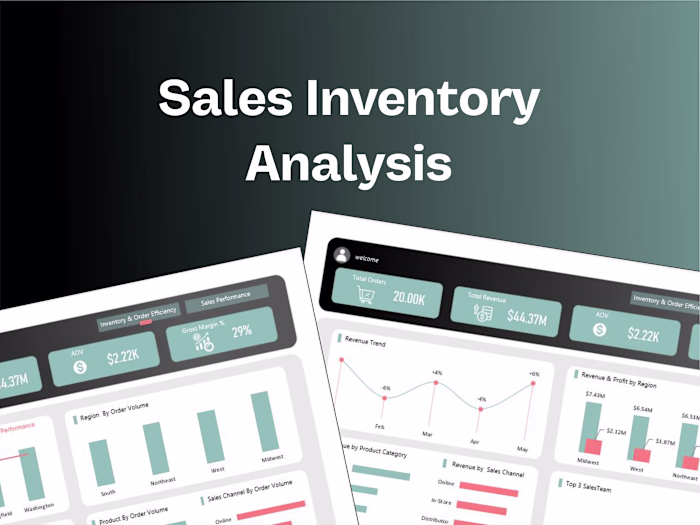
Comprehensive Company Performance Analysis
Yusuf Olanrewaju
PROJECT OVERVIEW
This project provides a data-driven analysis of a company's performance in three areas: Sales & Profit, Shipping & Delivery, and Customer Demographics & Behavior , using data from 2015-2018. It explores trends in revenue, profitability, order volume, shipping efficiency, and customer behavior across regions and product categories.
OBEJECTIVE
The objective of this project is to surface key patterns and performance gaps that can inform strategies for increasing revenue, streamlining operations, and strengthening customer engagement.
KEY METRICS:
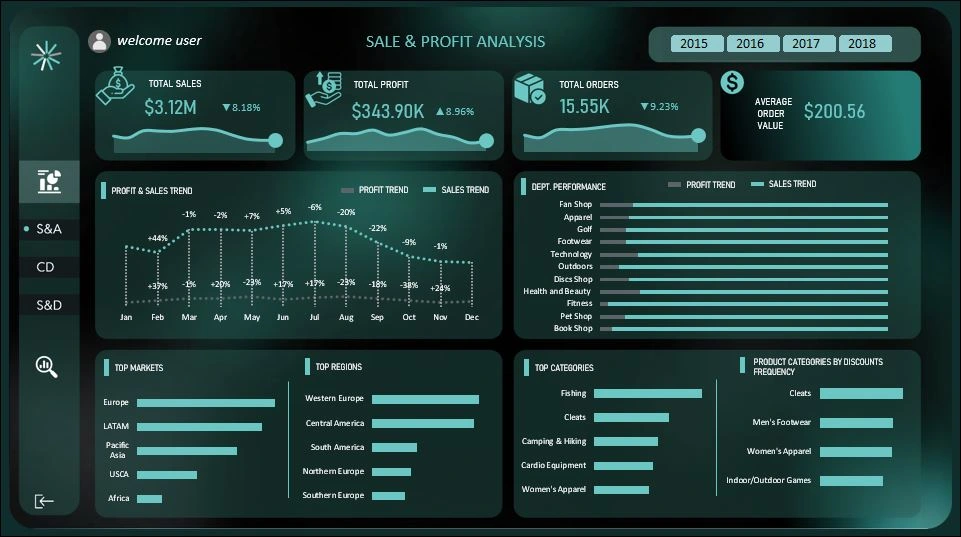
Total Sales: $3.12M (▼8.18%)
Total Profit: $343.90K (▲8.96%)
Total Orders: 15.55K ( ▼9.23%)
Average Order Value: $200.56
Dashboard 1 : Sales & Profit
KEY INSIGHTS:
+44% increase in sales and +37% increase in profit observed in the month of January, which is a healthy start. Moving forward the company has experienced inconsistency in profit and sales.
The technology departments and health & beauty departments have been able to hold a strong ground in profit and sales. Leaving behind the other departments. Strategies employed in this top performing departments can be adopted by other to maintain a balance across the departments.
Europe, LATAM, and Pacific Asia are the strongest markets
Western Europe and Central America drive regional performance.
Fishing, Camping & Hiking, and Cleats emerged as high-growth niches. This suggests strong core and potential in outdoor product lines.
Cleats standouts out as the product category in which discount is applied to the most
Dashboard 1 : Sales & Profit
Dashboard 2 : Customer Demographics & Behavior
KEY INSIGHTS:
High order volume early in January +37%, but sharp drop by September (–24%). Indicates a seasonal effects
The Consumer segment generated the highest sales of $1.66M with profit of $183.82K.
Most customers prefer the direct debit payment method, Cash usage is minimal, reflecting a shift toward digital-first transactions.
Customers prefer the Europe and LATAM market , while Africa stands as the least preferred market.
Most of the customers the company have are base in the city of Caguas.
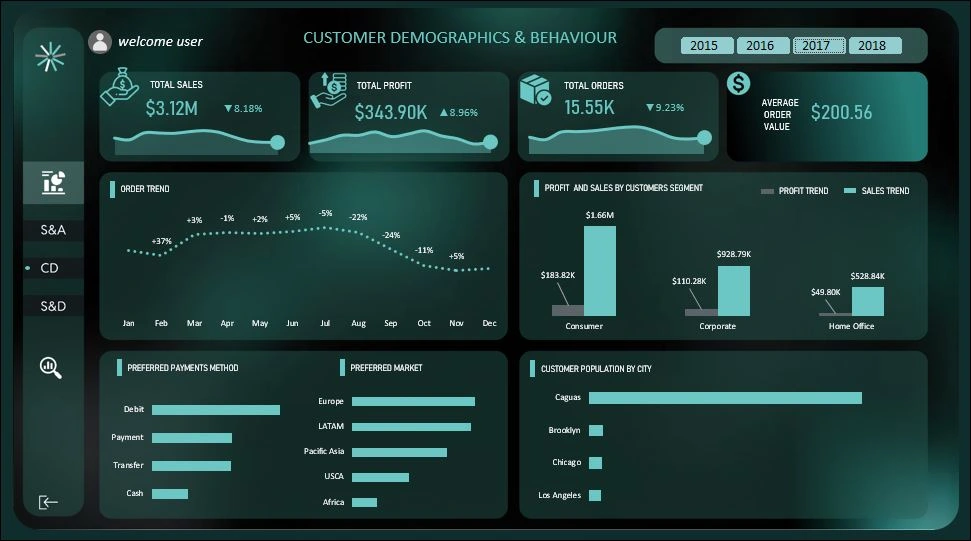
Dashboard 2 : Customer Demographics & Behavior
Dashboard 3 : Logistics
KEY INSIGHTS:
Throughout the year the company has consistently suffered delayed delivery which clearly shows operational inefficiencies
First class delivery mode is the delivery mode with the most delayed delivery compared with other delivery mode which has noticeable improvements on delivery time
Due to frequent delay in deliveries of first class mode of delivery , it shown to be the least preferred mode of delivery by customers alongside same day delivery mode which is also least preferred due to increased charges in delivery
Cleats and women apparel are the product categories that are mostly delivered on time
Western Europe and Central America are the region experiencing the most delays in delivery
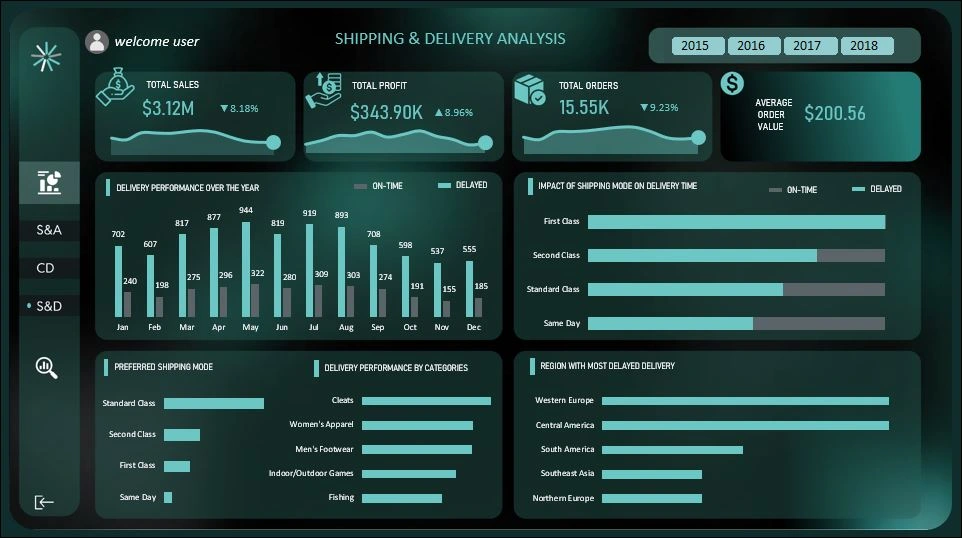
Dashboard 3 : Logistics
STEPS TO TAKE:
Stabilize sales with loyalty and seasonal campaigns, expand outdoor product lines, and replicate winning strategies from top-performing departments.
Double down on Europe, LATAM, and Pacific Asia; fix bottlenecks in Western Europe & Central America; reassess Africa.
Prioritize the Consumer segment, encourage digital payments, and use Caguas as a pilot hub for testing growth strategies.
Improve delivery reliability , redesign/phase out First-Class delivery, reprice Same-Day delivery, and replicate successful category-level delivery processes.
CONCLUSION
This analysis delivers a comprehensive overview of the company’s performance through out the years, encompassing sales, logistics, and customer engagement. Despite a decline in overall.
The company possess potential to optimize opportunities to maintain sales and profit growth. The shipping performance analysis identified significant delivery challenges, particularly in specific regions and modes, while customer insights revealed profitable segments and emerging market opportunities.
These findings provide actionable insights to guide data-driven decisions. By focusing on improving operational efficiency, maximizing opportunities through customer preferences the company can drive more sales and generate more profits for itself.
Like this project
Posted Sep 16, 2025
This project provides a data-driven analysis of a company's performance in 3 areas: Sales & Profit, Shipping & Delivery, and Customer Demographics & Behavior
Likes
1
Views
8
Timeline
Jul 16, 2025 - Jul 24, 2025